2020 Student Loan Debt Statistics

Student debt is a bigger problem than ever. 

Anyone who has been paying attention the past decade knows that pursuing higher education requires a much larger financial investment than in the past. 

The average cost of a 4-year education has nearly tripled over the past three decades [1] and more students are forced to take out loans to cover the cost of education.

We compiled a list of stats around the growing student debt crisis including how much is owed, the types of debt, and what the outlook is.

The Total Student Loan Debt Reached $1.53 Trillion in 2020
Contents Show

1. The Total Student Loan Debt Reached $1.53 Trillion in 2020

The total amount of outstanding student loan debt reached an enormous $1.5 trillion in 2020 [2].

To put that number in perspective, $1.5 trillion is higher than the GDP of nearly half of the world’s countries and about equal to the GDP of several developed nations such as South Korea, Spain, Russia, Canada, and Australia. 

To put the point another way, if you had $1.5 trillion and spent a dollar every second, it would take you over 30,000 years to spend it all, assuming you were not making any extra money.

The Average Student Loan Debt in the US Is $28,565

2. The Average Student Loan Debt in the US Is $28,565

Based on data gathered for the class of 2018, the average student loan debt per borrower was $28,565. 

This value was up $277 from the class of 2017 which had an average debt per borrower of $28,288 [3]. Connecticut is the state with the highest average debt student debt per borrower at $38,510.

44.5 Million People Have Some Student Debt

3. 44.5 Million People Have Some Student Debt

Nearly 1 in 4 Americans have some amount of student debt, which is about 44.5 million people [4]. A sizable majority of these borrowers are under the age of 60.

Borrowers between the ages of 25 and 43 have the highest amount of student debt while borrowers aged 35-49 have the highest delinquent balances [5]. The majority of older people with loans have them as a result of cosigning. 

90% of Student Loan Debt Is From Federal Loans

4. Nearly 90% of Student Loan Debt Is From Federal Loans

The vast majority of existing student loan debt is owned by the US Dept. of Education. Nearly $1.45 trillion of the student loan total is owed in federal loans. 

In contrast, private loans make up only $119 billion [6]. Additionally, most private loan holders also have federal loans. 

The Average Monthly Student Loan Payment Is Nearly $400

5. The Average Monthly Student Loan Payment Is Nearly $400

Over the course of a year, the average debt holder pays nearly $4,800 a year which comes out to around $400 a month. The median monthly student loan payment is only $222.

This amount has increased by nearly $150 from the average payment of $227 in 2005 [2].

Borrowers for Graduate Degrees in Medicine and the Health Sciences Have the Highest Average Debt

6. Borrowers for Graduate Degrees in Medicine and the Health Sciences Have the Highest Average Debt

The average amount of student debt for those who earned a medical degree was $161,772. The next highest degree was Law at $140,616, and Master’s degrees at $58,539. 

Out of all graduate degree seekers, those with the least amount of debt were those earning their MBAs with an average debt of $42,000 [2].

Nearly 1 in 10 of every federal loan borrower is in default on their student loans

7. Around 11% of Borrowers Are in Default on Their Student Loans

Nearly 1 in 10 of every federal loan borrower is in default on their student loans [7]. In fact, only 56% of federal student loan debt is being repaid; the rest is in either deference, forbearance, or defaulted.

2/3 of Defaulted Loans are by Borrowers Who Owe Less Than $10,000

 8.  2 Thirds of Defaulted Loans in the First 3 Years Are by Borrowers Who Owe Less Than $10,000

Despite what you may think, those with the highest debt amount do not have the highest default rates. The opposite is true, those with smaller debt amounts have the highest initial default rates.

Borrowers who owe less than $10,000 represent two-thirds of defaults that happen in the first 3 years of repayment [6].

Private Student Loan Debt Has Grown by 20 Percent in the Past 6 Years

9. Private Student Loan Debt Has Grown by 20 Percent in the Past 6 Years

Although federal loans make up the majority of student loan debt, the total amount of private student debt is growing rapidly. Private student loan debt grew by more than 20% from 2014-2020 [8].

The Cost of University Has More Than Doubled in the Past 30 Years

10. The Cost of University Has More Than Doubled in the Past 30 Years

Data collected over the past thirty years shows that the average cost of tuition, room and board, and expenses for a 4-year university has nearly doubled. The same data shows the cost for private universities has nearly tripled, even when accounting for inflation [2].

More Americans Are Opting for Higher Education, Despite the Rising Costs

11. More Americans Are Opting for Higher Education, Despite the Rising Costs

Despite the rising cost of education and ballooning student debt, more Americans are opting into higher education.

Nearly 60% of those 25 and older have gone to college for some period of time [2].

The Majority of Federal Loans Are Handled by AES-PHEAA

12. The Majority of Federal Loans Are Handled by AES-PHEAA

Most people with federal student debt don’t make payments directly to the government. They instead use loan servicers as go-betweens. Most federal direct loans are handled by FedLoan Servicing which is known as AES-PHEAA [2].

Nearly 3 Million People Owe Over $100k or More

13. Nearly 3 Million People Owe Over $100k or More

The majority of borrowers owe under $40,000 but nearly 2.8 million borrowers owe over $100,000. 

Those who owe more than $100,000 hold about 34% of the total student debt [6].

About 18.6 Million Federal Loan Borrowers Are in Repayment

14. About 18.6 Million Federal Loan Borrowers Are in Repayment

Currently, 18.6 million federal loan holders are in the repayment phase. 

That’s around 42% of the total amount of debt holders. The rest of the federal debt is in deferment, forbearance, or default [9].

Nearly 48% of Borrowers Cannot Make a Dent in Their Balance Due to Interest

15. Nearly 48% of Borrowers Cannot Make a Dent in Their Balance Due to Interest

As of 2018, around 48% of borrowers were unable to decrease their balance from quarter to quarter. 

Increased interest rates mean their balance is accumulating interest faster than they can pay off [10].

Black Students Are More Likely to Take out Loans Than Their White Counterparts

16. Black Students Are More Likely to Take out Loans Than Their White Counterparts

Data seems to imply that black students are more likely to borrow to finance their education. Some 80% of black students take out federal loans compared to some 60% of white students [11]

Moreover, black students owe about $7,400 more on average than white, Asian, and Latino students. 

Women, in General, Need to Use a Higher Percentage of Their Income to Pay off Student Debt

17. Women, in General, Need to Use a Higher Percentage of Their Income to Pay off Student Debt

Student debt payments seem to affect women the most. White women and black women typically owed 92% and 111% of their first-year annual income post-graduation, respectively. 

This figure is compared to 70% and 89% for white and black men, respectively [8].

Most Student Loans Are Stafford Subsidized Loans

18. Most Student Loans Are Stafford Subsidized Loans

The majority of student loans (29.7 million) are direct Stafford subsidized loans. Subsidized loans receive federal assistance to make interest payments [8].

Student Loan Borrowing Reached Its Peak in 2011

19. Student Loan Borrowing Reached Its Peak in 2011

2011 was the highest year for student loan borrowing in which $127.7 billion in federal loans was taken out. 

Borrowing has declined 7 years in a row and is now at $105.5 billion for 2018 [6].

99.5% of Those Who Apply for Public Loan Forgiveness Are Denied

20. 99.5% of Those Who Apply for Public Loan Forgiveness Are Denied

In 2018, there were about 50,000 applications for public loan forgiveness programs. Of those, only about 420 applications were approved. 

72% were rejected because they did not meet the requirements and 37% were rejected because of incomplete information [12].

Student Loan Debt Is the Second Largest Debt Category in the US

21.  Student Loan Debt Is the Second Largest Debt Category in the US

As of 2019, student loan debt is the second largest category of debt in the country, just under the total amount of housing debt [13].

The rates of student loan borrowers over the age of 60 have increased by 1,256% in the past 15 years

22. Student Loan Debt Among Borrowers 60+ Years Old Has Increased 12-Fold in 15 Years

The rates of student loan borrowers over the age of 60 have increased by 1,256% in the past 15 years. Most older borrowers cosign with another member of their family [8].

The Average Time to Pay off Student Debt Is 21.1 Years

23. The Average Time to Pay off Student Debt Is 21.1 Years 

Estimates hold that the average time to pay off student loan debt is 21.1 years. Graduate degrees take a longer time to pay off at 23 years. The data on this subject is very limited though and more research is needed to pin down exact figures [14].

Students Who Complete Their Degrees Are Twice as Likely to Pay off Their Loans

24. Students Who Complete Their Degrees Are Twice as Likely to Pay off Their Loans

Perhaps unsurprisingly, those who completed their college degrees were two times as likely to repay their loans and 8 times less likely to be in default. 

80% of degree holders were in repayment or had repaid their loans [14].

7.37 Million Borrowers Are on Income-Driven Repayment Plans

25. 7.37 Million Borrowers Are on Income-Driven Repayment Plans

Around 16% of borrowers (7.37 million) are on income-driven repayment plans. These plans base monthly payments off of net income [9].

75% of Private College Graduates Have Student Debt

26. 75% of Private College Graduates Have Student Debt

Since most private schools are more expensive than public universities, private school graduates usually have higher amounts of student debt.

Only 66% of public school graduates have student loans [15].

Private School Graduates Have Higher Average Debt

27. Private School Graduates Have Higher Average Debt

Again perhaps unsurprisingly, private school graduates have a higher average debt burden than public school grads.

The average student debt for private school graduates was $32,300 compared to $28,650 for public school graduates [15].

8.86% Is the Average Interest Rate on Private Loans

28. 8.86% Is the Average Interest Rate on Private Loans

Once again, private loans have higher interest rates than federal loans. The average interest rate for private loans in 2019 was 9.96%. The average variable rate was 9.91% and the average fixed interest rate was 9.97% [16].

Millennials Who Have Student Loans Have Half as Much Saved for Retirement by Age 30

29. Millennials Who Have Student Loans Have Half as Much Saved for Retirement by Age 30

Student loans also affect peoples’ ability to save for retirement.

Data shows that college graduates without debt have saved nearly twice as much by age 30 than college graduates who took out loans. Those who had no debt had saved an average of $18,200 for retirement while those who did have debt only saved an average of $9,100 [17].

48% of Undergrads Put off Buying a House Due to Student Debt

30. 48% of Undergrads Put off Buying a House Due to Student Debt

The effects of student debt are far-reaching. Nearly 48% of recent graduates said they were putting off buying a house due to student debt payments being too burdensome.

Moreover, college graduates with the median amount of student debt do not expect to be able to own a home until they are 35 [18].

 Conclusions

The student debt crisis is having far-reaching consequences.

As the debt burden increases, more people are essentially locked out of participating in the economy in a meaningful way, which has detrimental effects on the growth of the economy.

Some experts argue that a policy canceling the federal student debt would marginally increase the nation’s debt burden while adding a solid 1% growth to the nation’s GDP.  

Citations
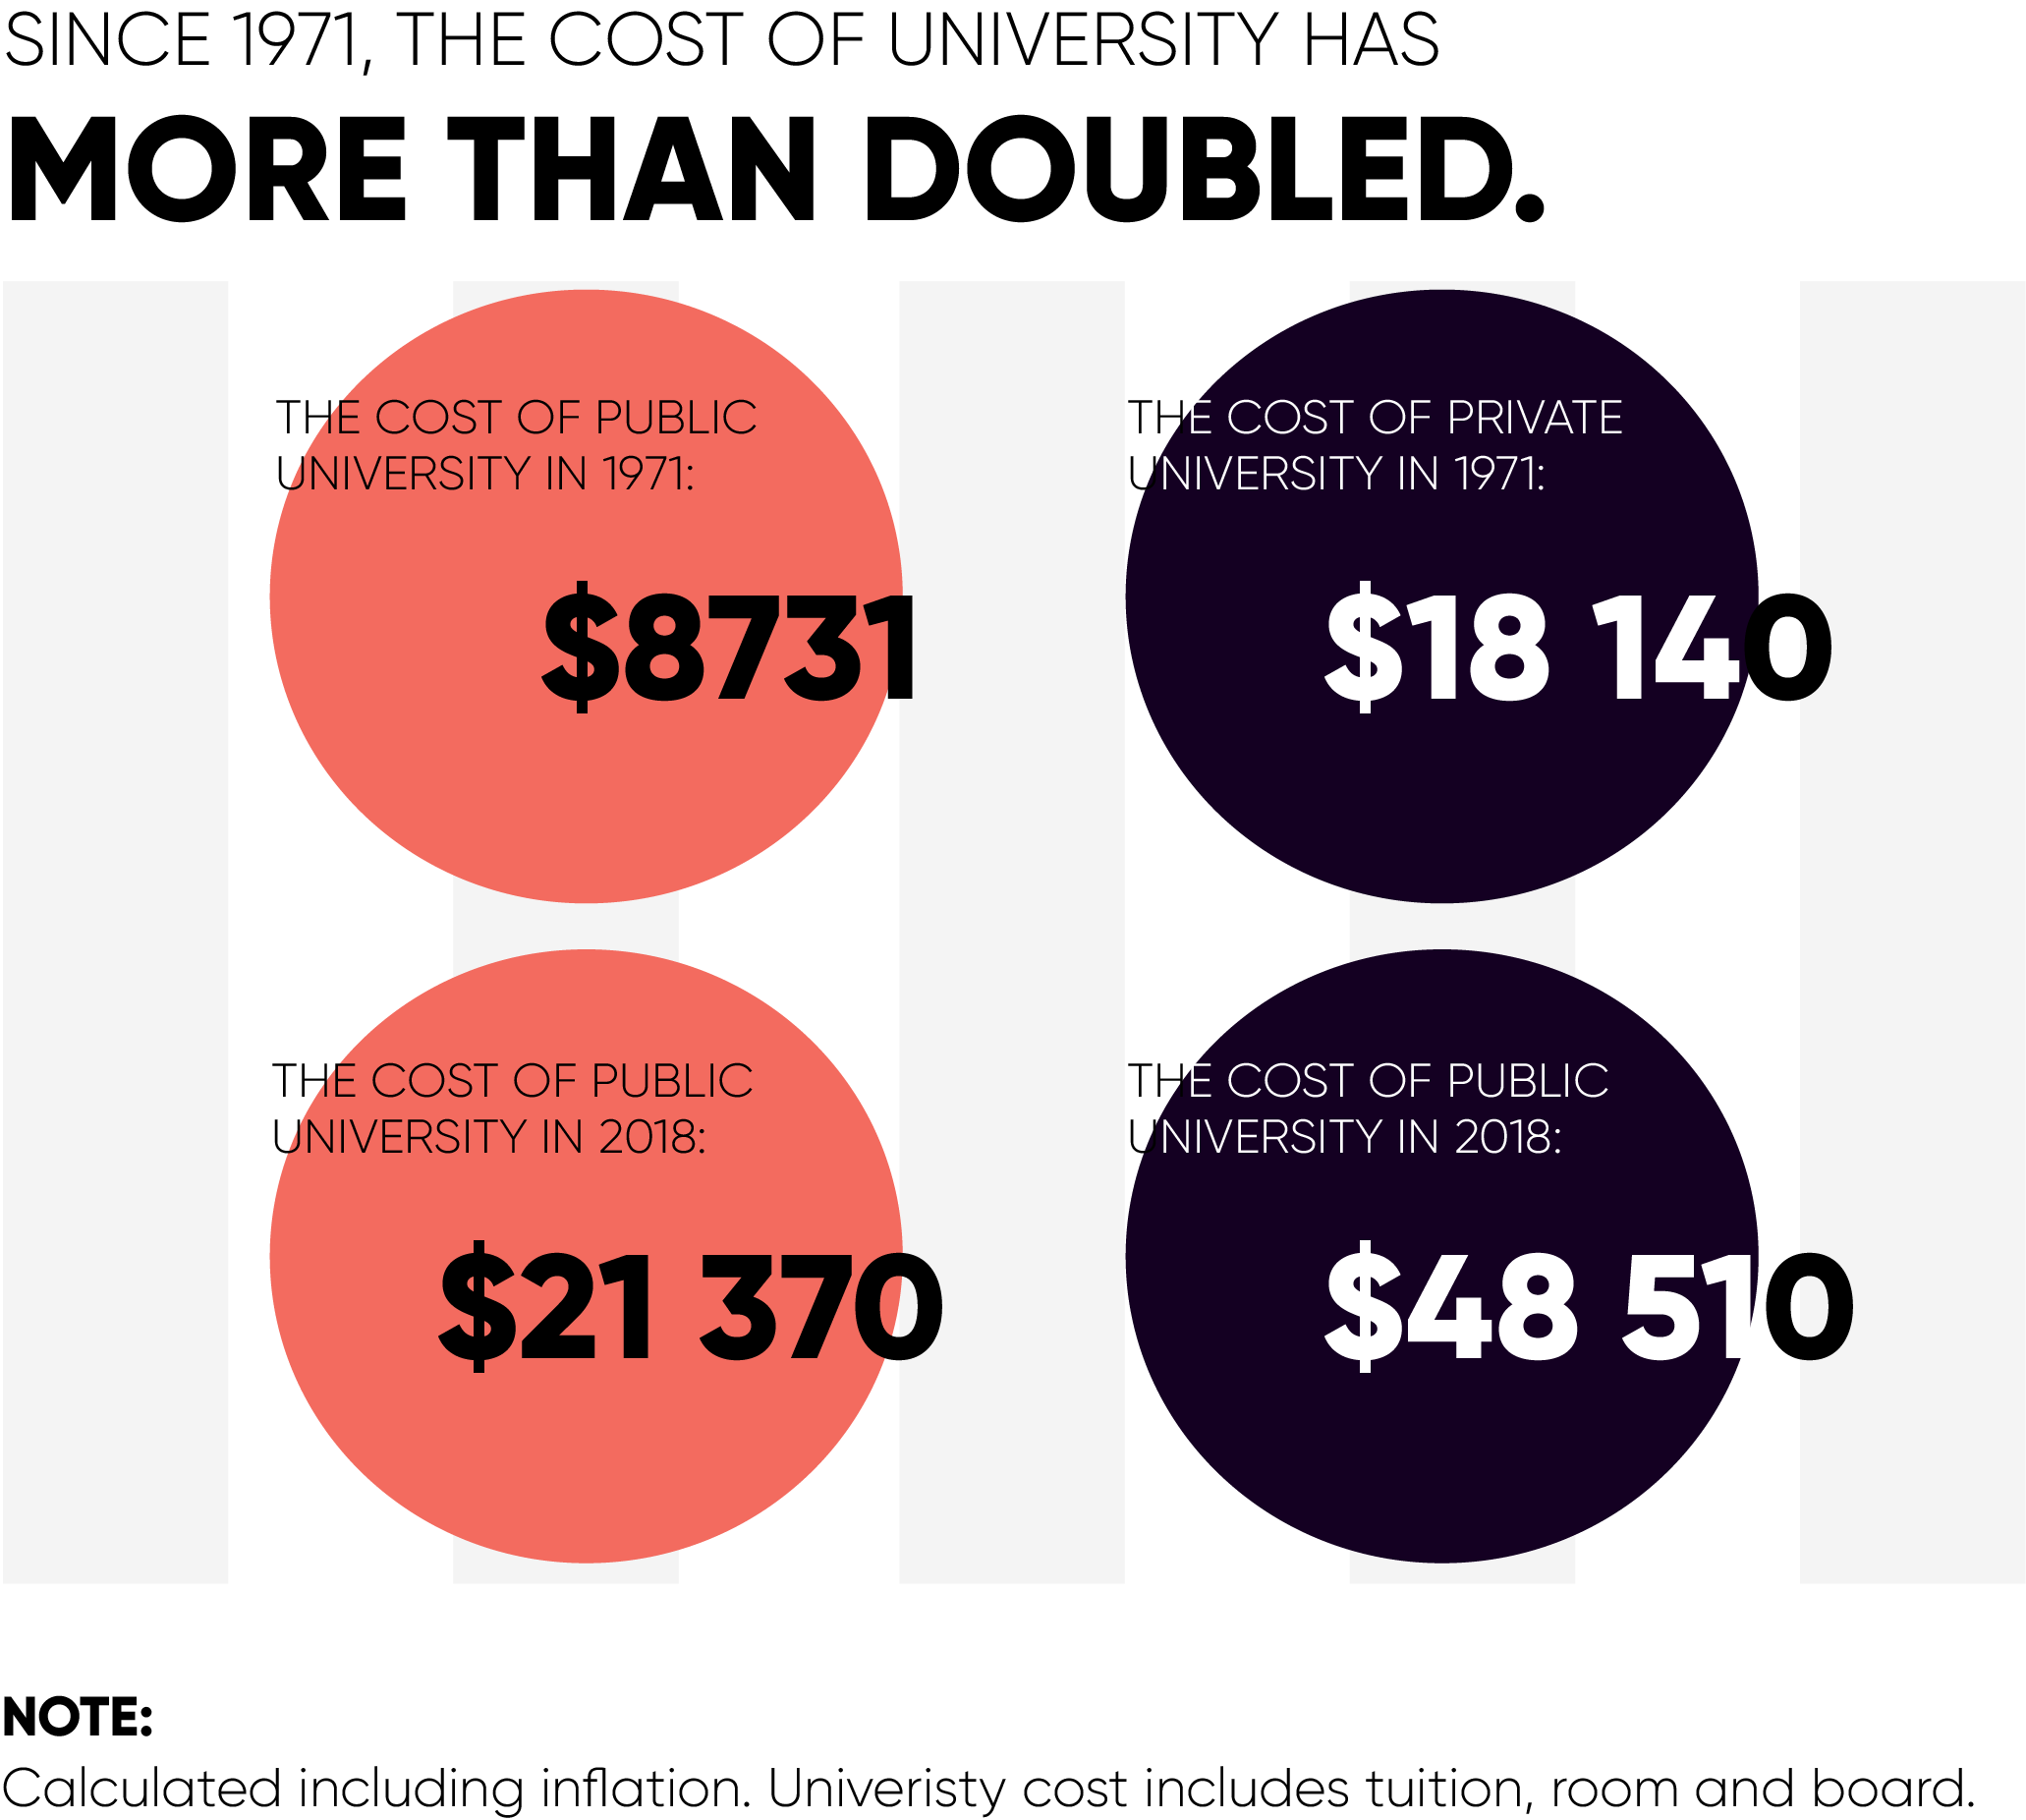
  1. “Trends in College Pricing 2019 Highlights.” Research, 6 Nov. 2019, research.collegeboard.org/trends/college-pricing/highlights. []
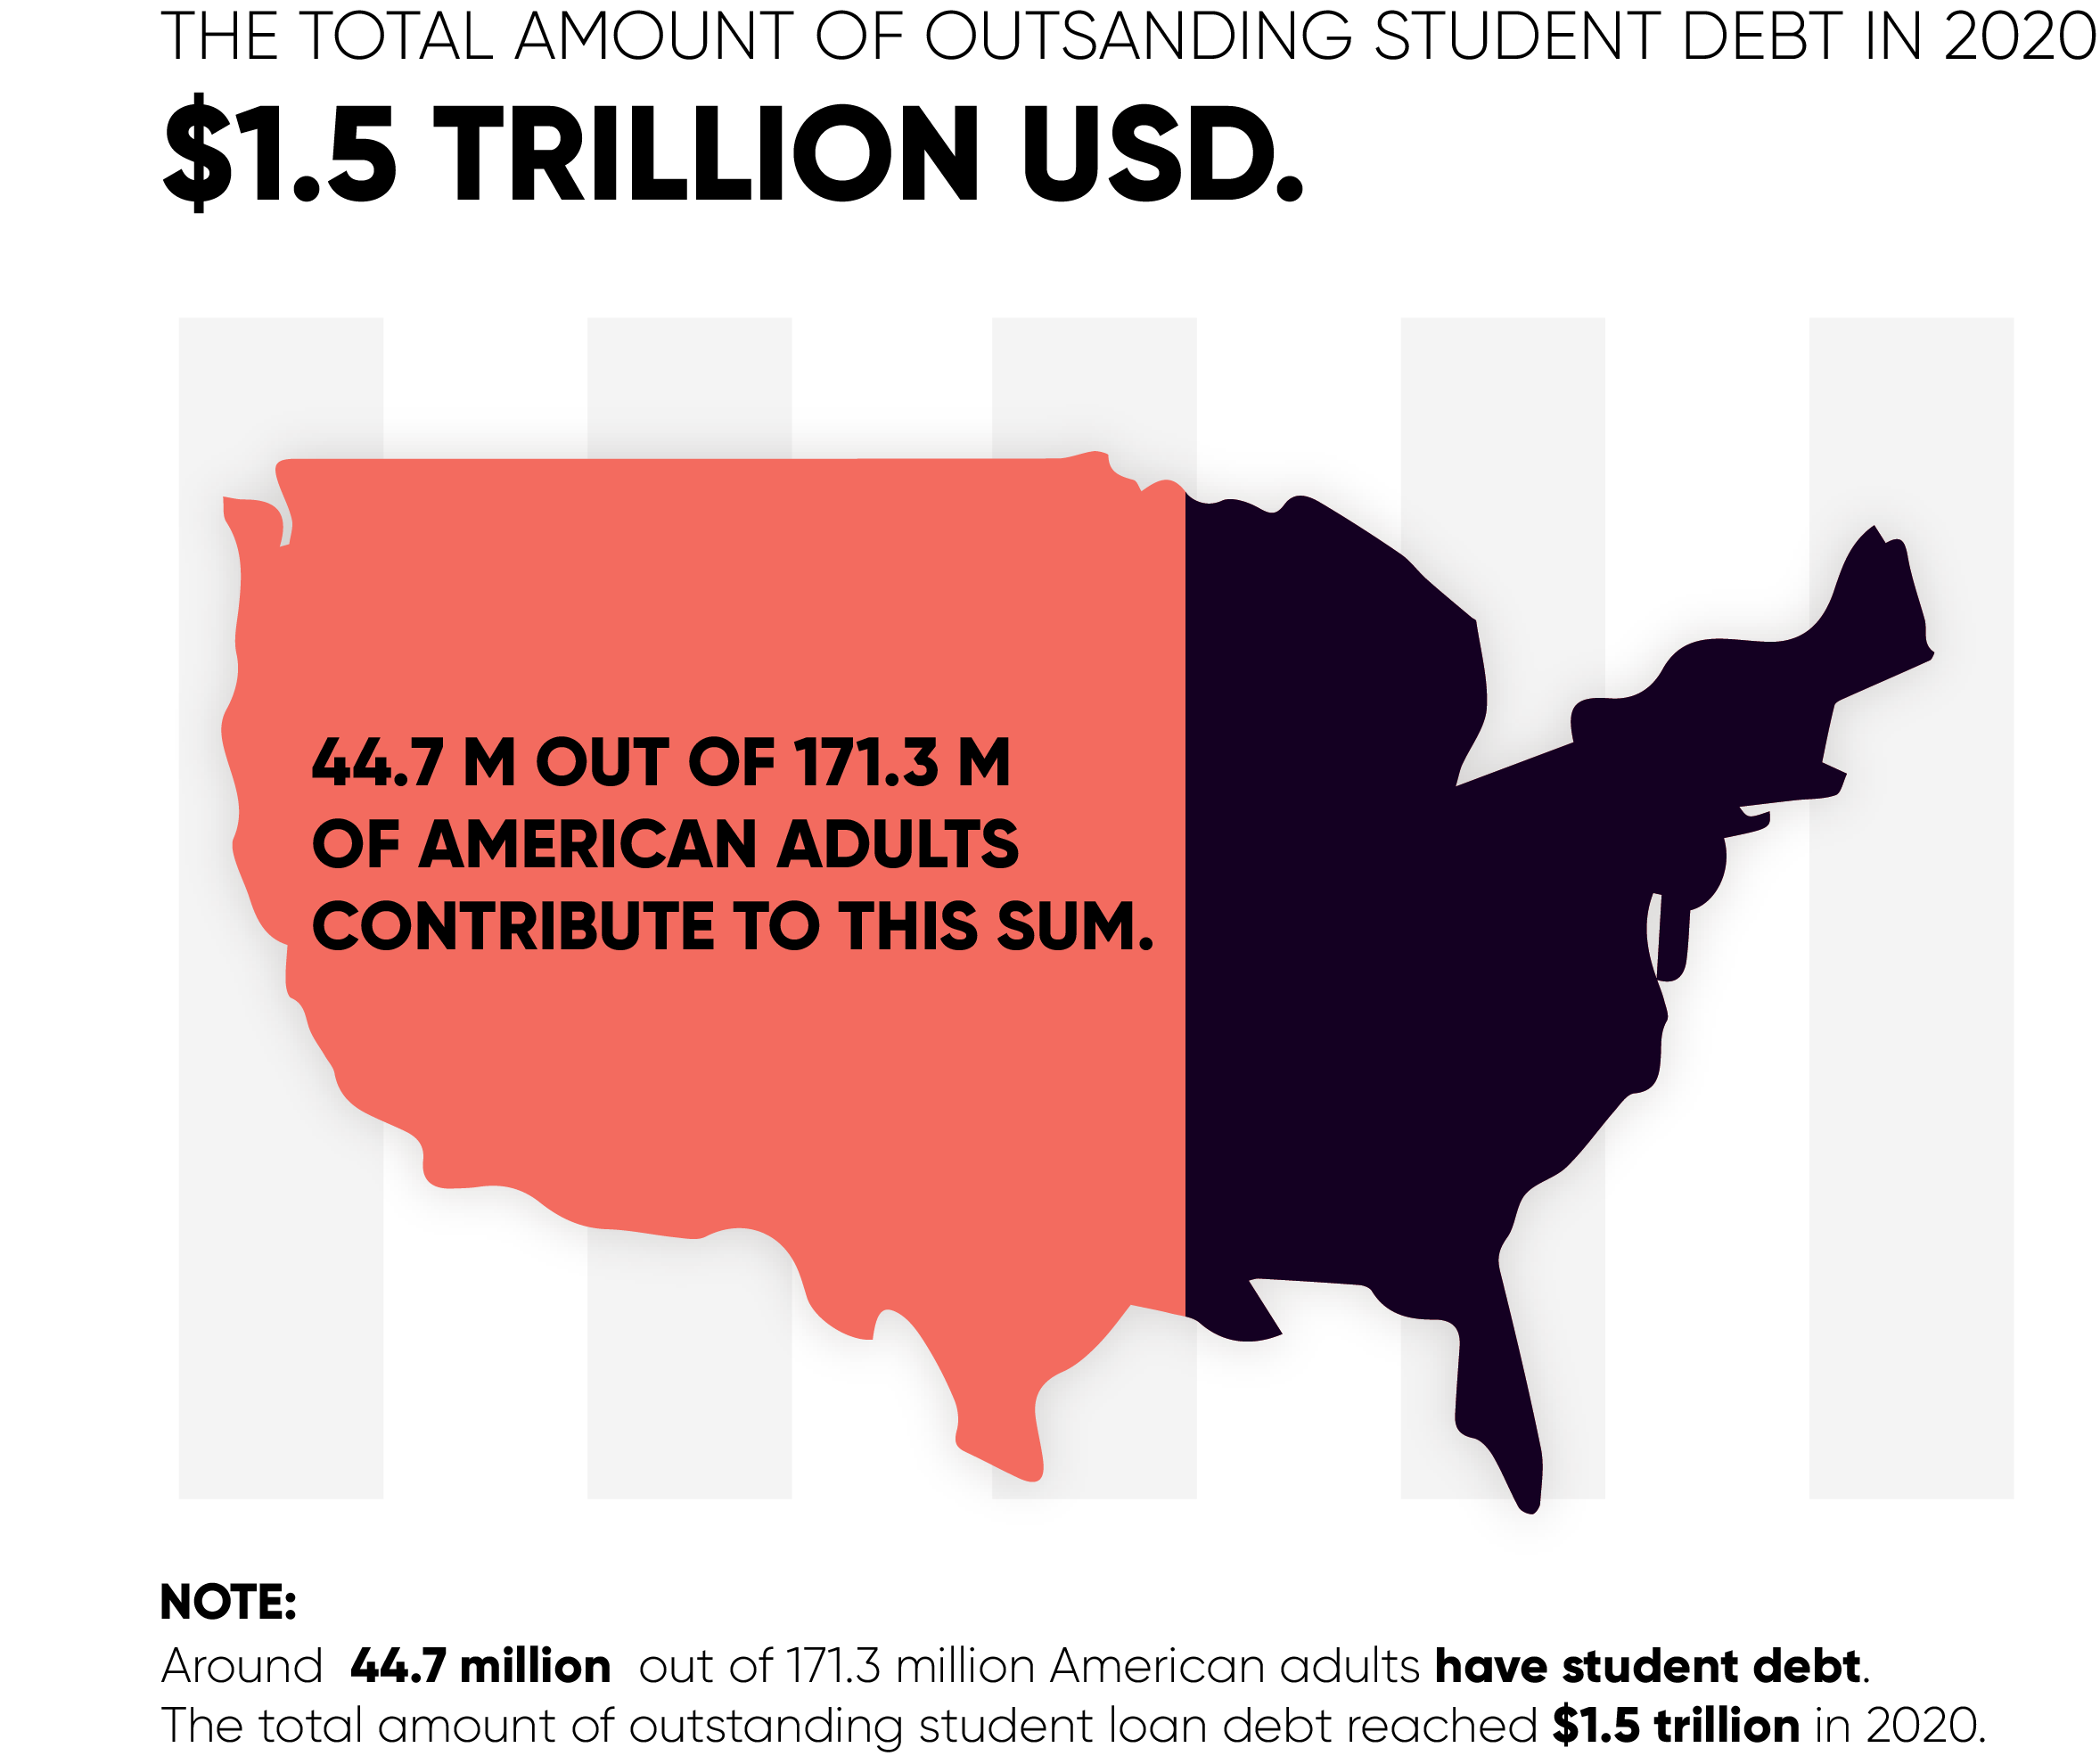
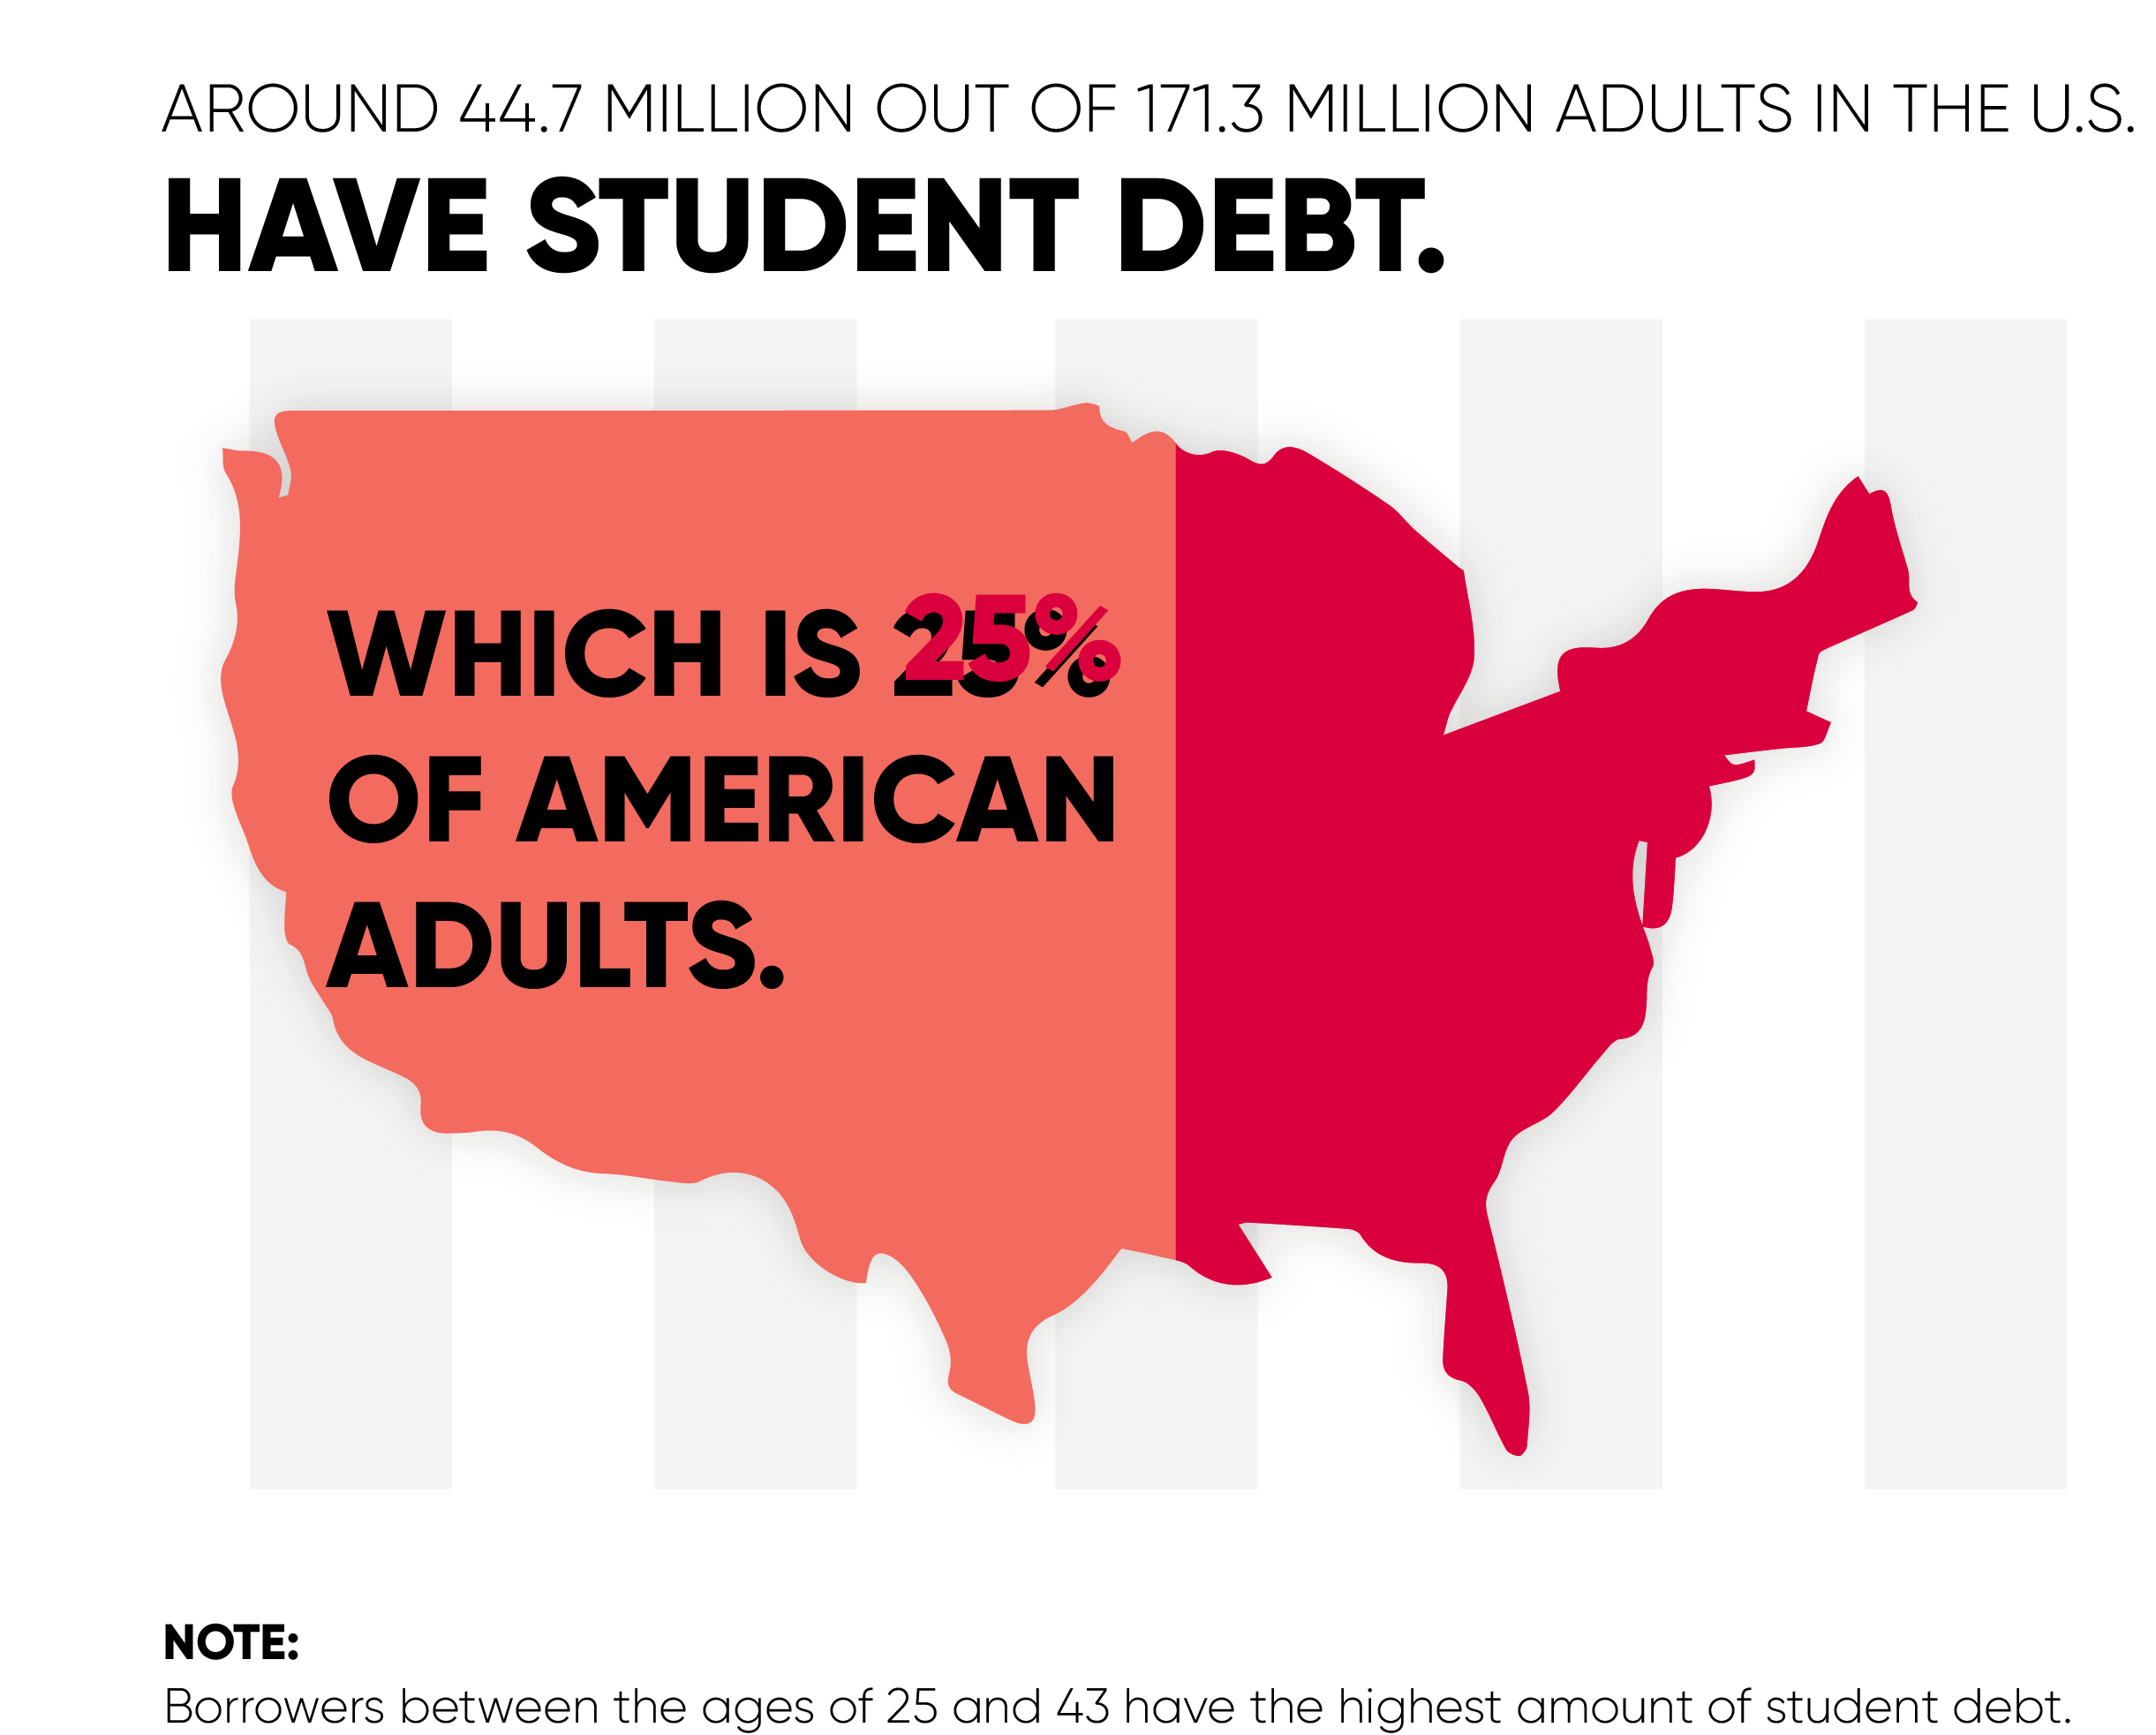
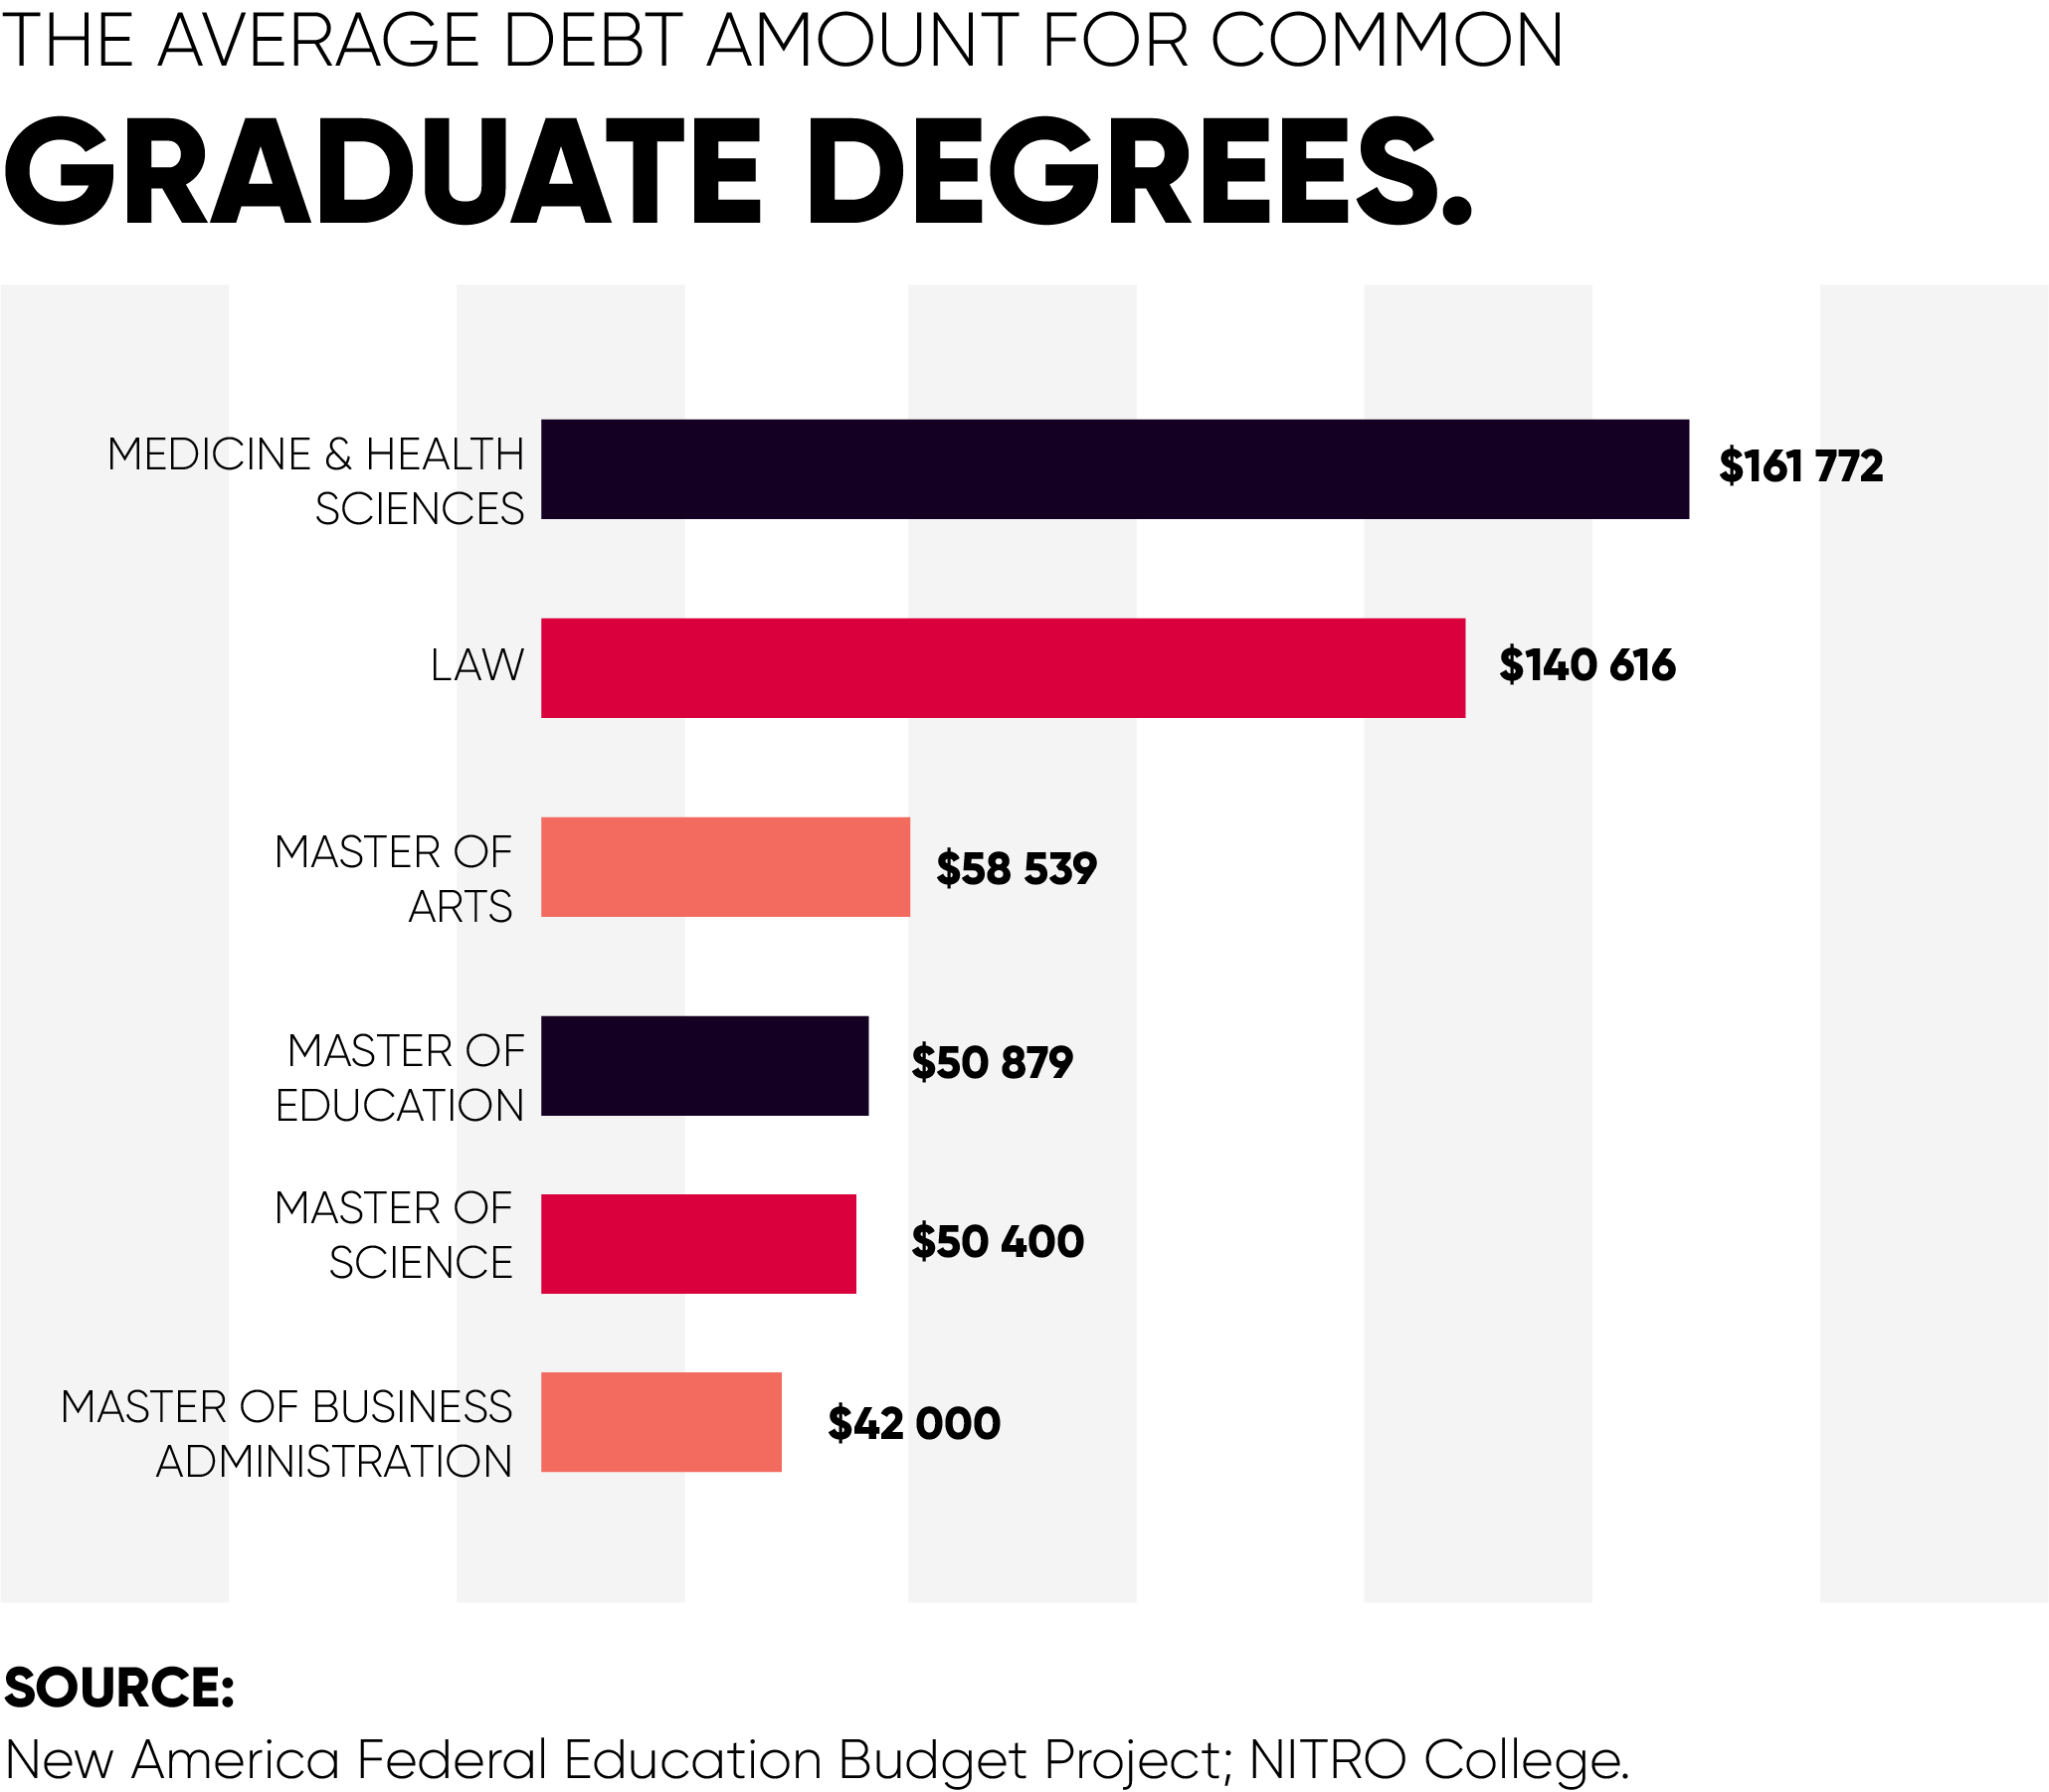
  2. “Average Student Loan Debt in the U.S. – 2020 Statistics.” Nitro College, Nitro College, www.nitrocollege.com/research/average-student-loan-debt. [] [] [] [] [] []
  3. “Student Loan Debt by School by State Report 2019.” LendEDU, LendEDU, 8 Aug. 2019, lendedu.com/student-loan-debt-by-school-by-state-2019/. []
  4. Lockert, Melanie. “Student Loan Debt Statistics for 2020 [Average Student Loan Debt].” Student Loan Planner, 9 Jan. 2020, www.studentloanplanner.com/student-loan-debt-statistics-average-student-loan-debt/. []
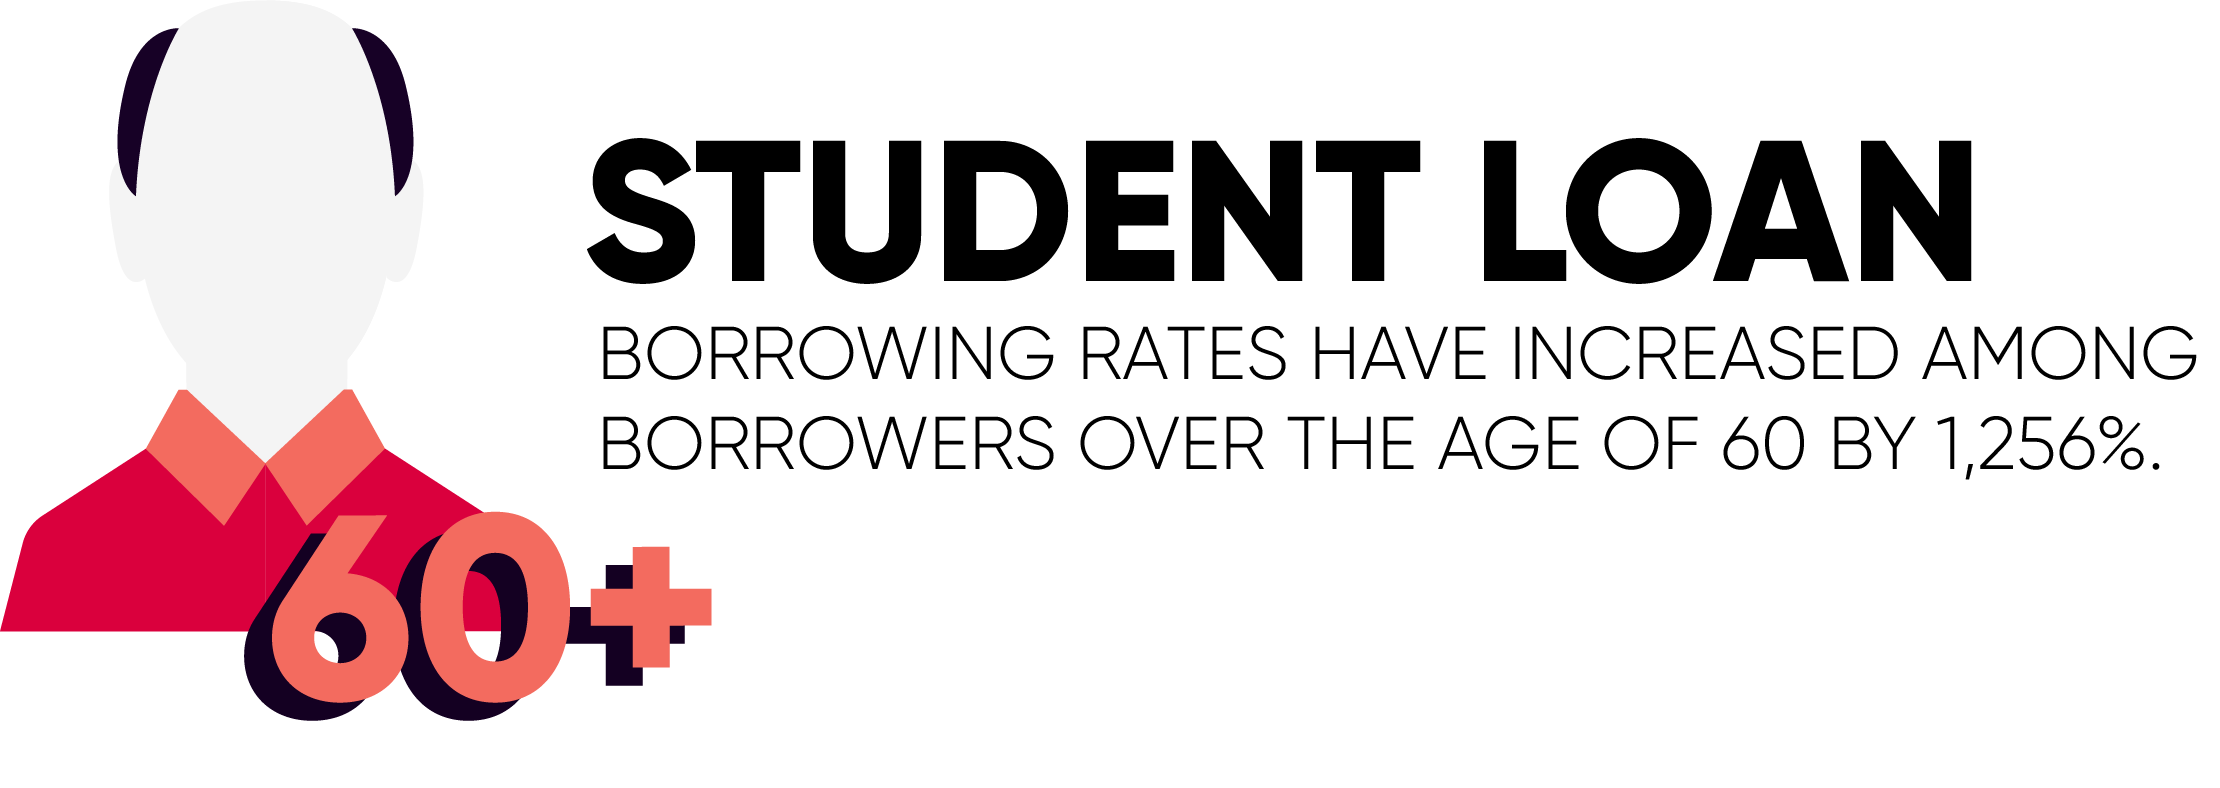
  5. Lembo Stolba, Stefan. “Student Loan Debt Delinquency by Age.” Experian, 16 Oct. 2019, www.experian.com/blogs/ask-experian/research/student-loan-debt-delinquency-by-age/. []
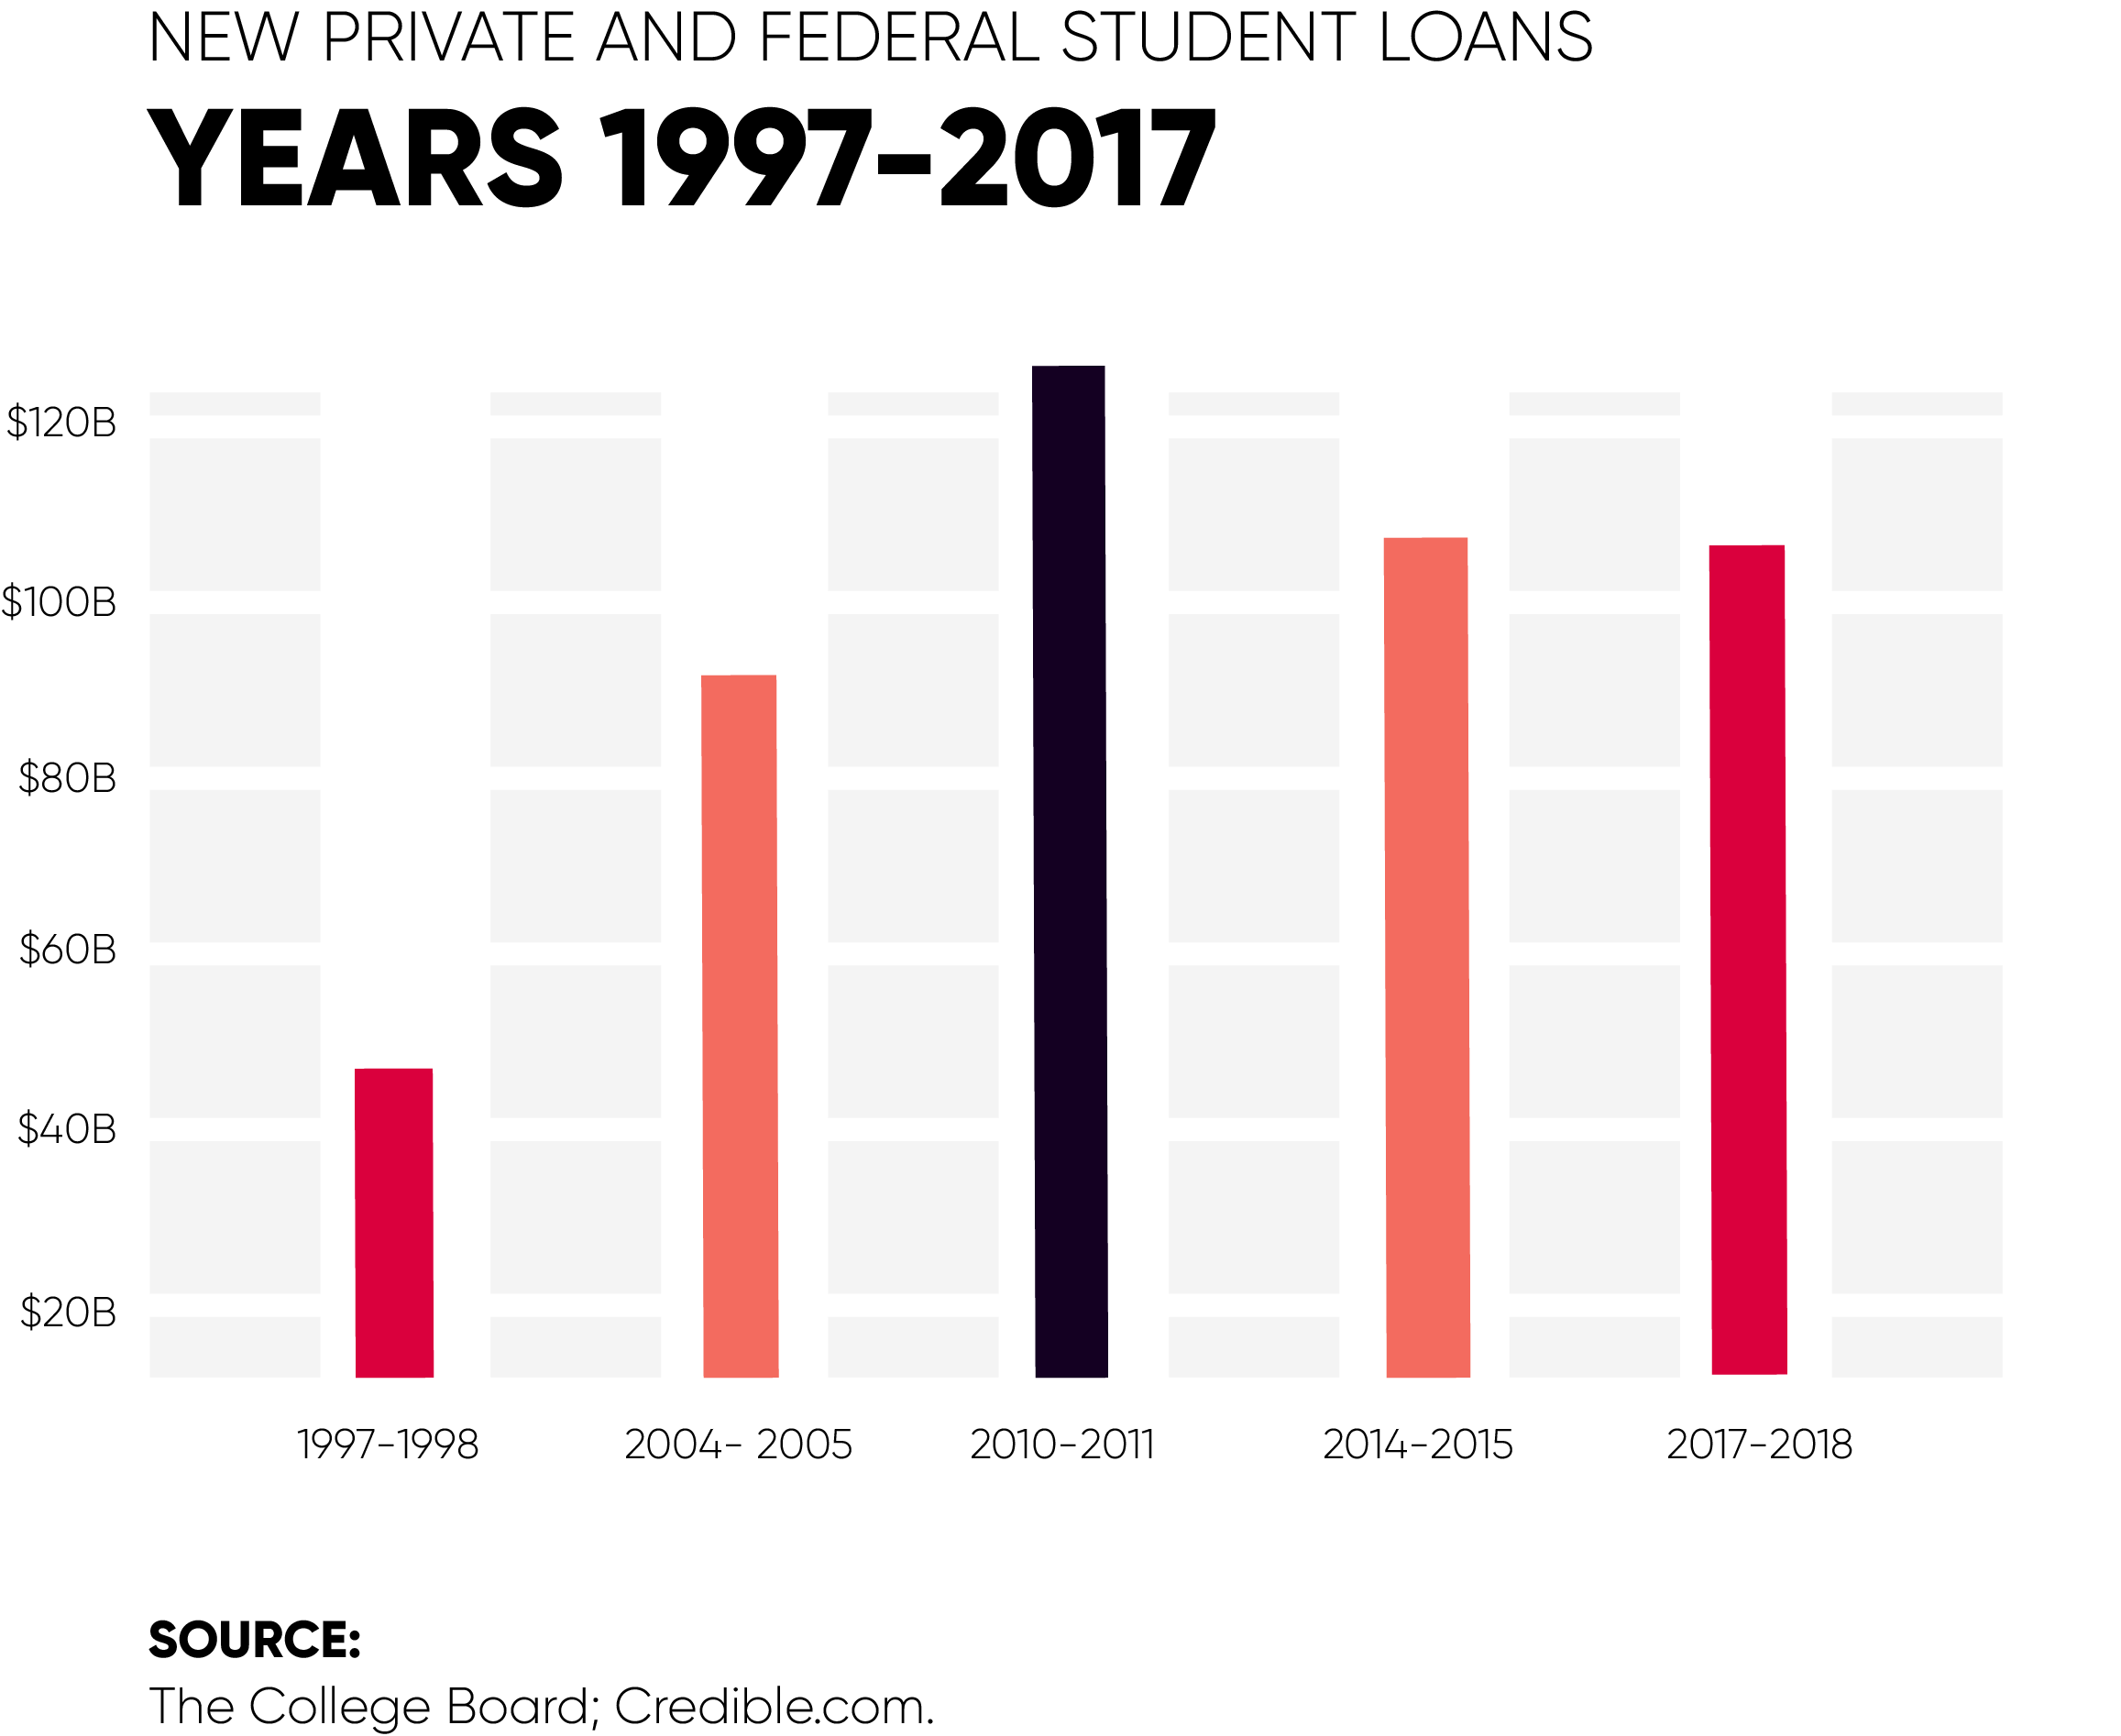
  6. Carter, Matt. “U.S. Average Student Loan Debt Statistics.” Credible, Credible, 18 Nov. 2019, www.credible.com/blog/statistics/average-student-loan-debt-statistics/. [] [] [] []
  7. Hagen, Kailey. “5 Student Loan Debt Statistics You Won’t Believe.” The Ascent, The Ascent, 28 Sept. 2019, www.fool.com/the-ascent/student-loans/articles/5-student-loan-debt-statistics-you-wont-believe/. []
  8. Song, Justin. “Average Student Loan Debt in America: 2019 Facts & Figures.” ValuePenguin, 17 Sept. 2019, www.valuepenguin.com/average-student-loan-debt. [] [] [] []
  9. Nykiel, Teddy. “2019 Student Loan Debt Statistics.” NerdWallet, 20 Dec. 2019, www.nerdwallet.com/blog/loans/student-loans/student-loan-debt/. [] []
  10. Morgan, Kyle. “Student Loan Debt Statistics of 2020: Facts and Figures.” Finder, 8 Nov. 2017, www.finder.com/student-loan-debt-statistics. []
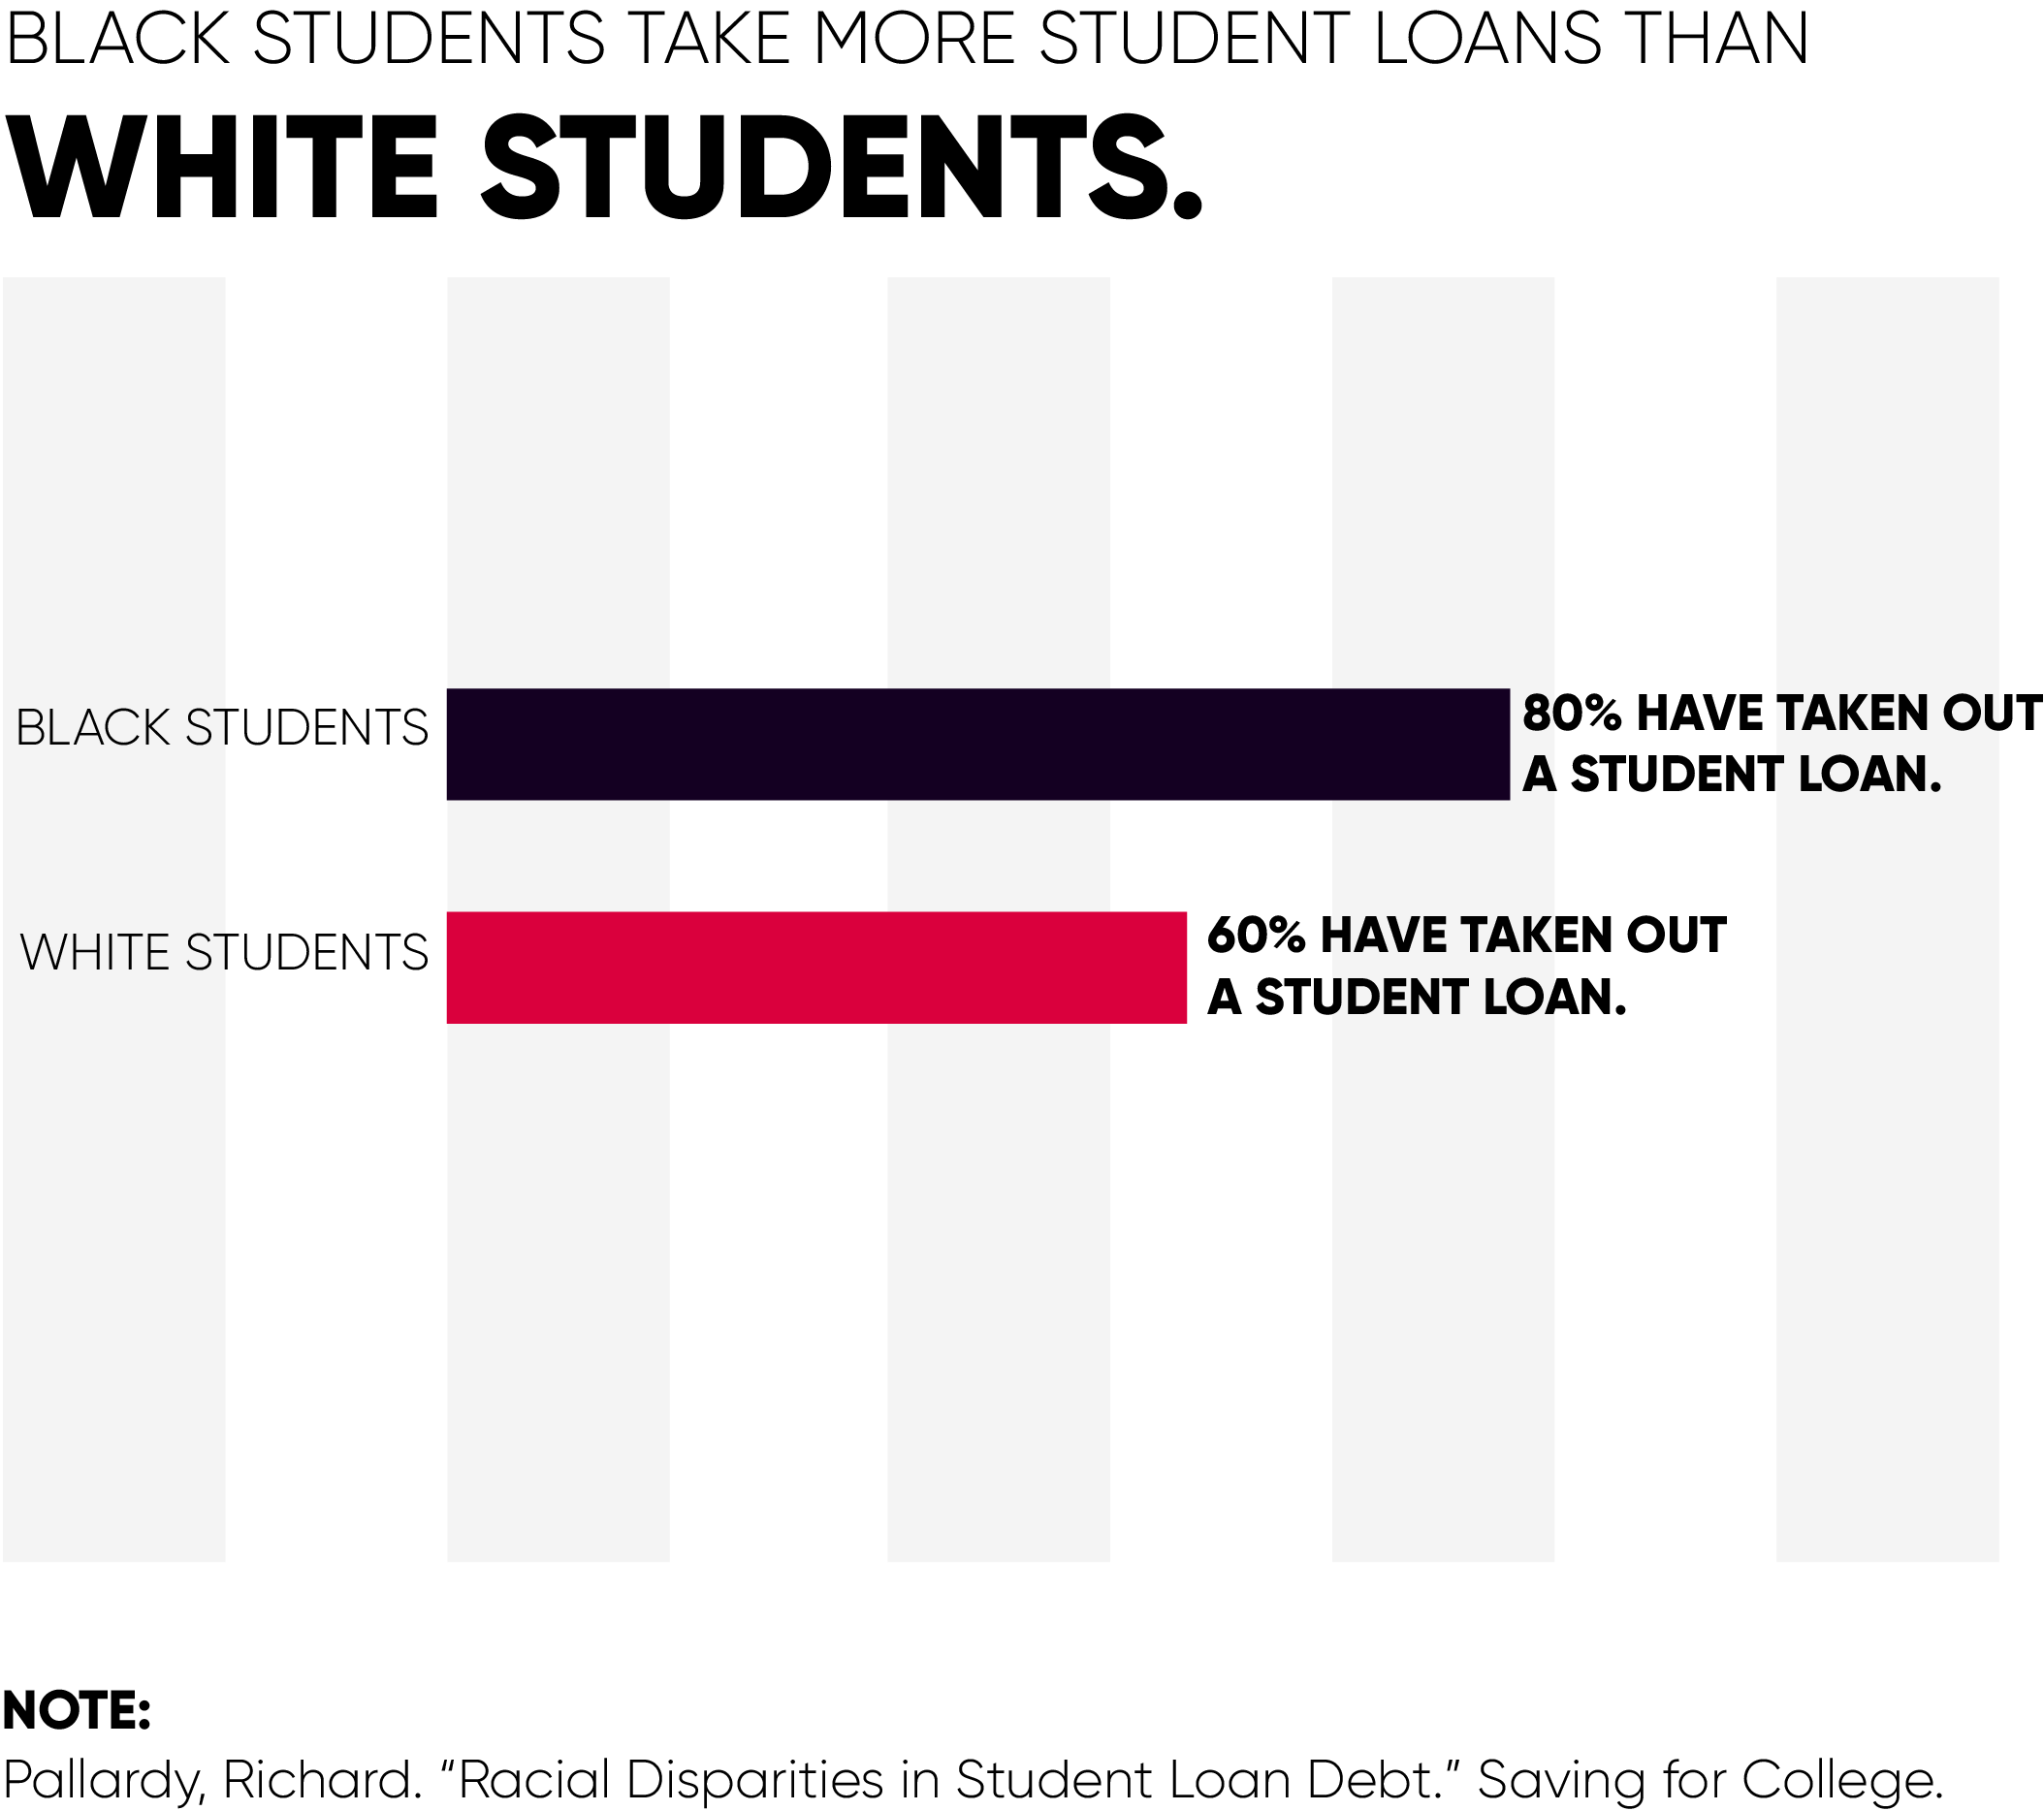
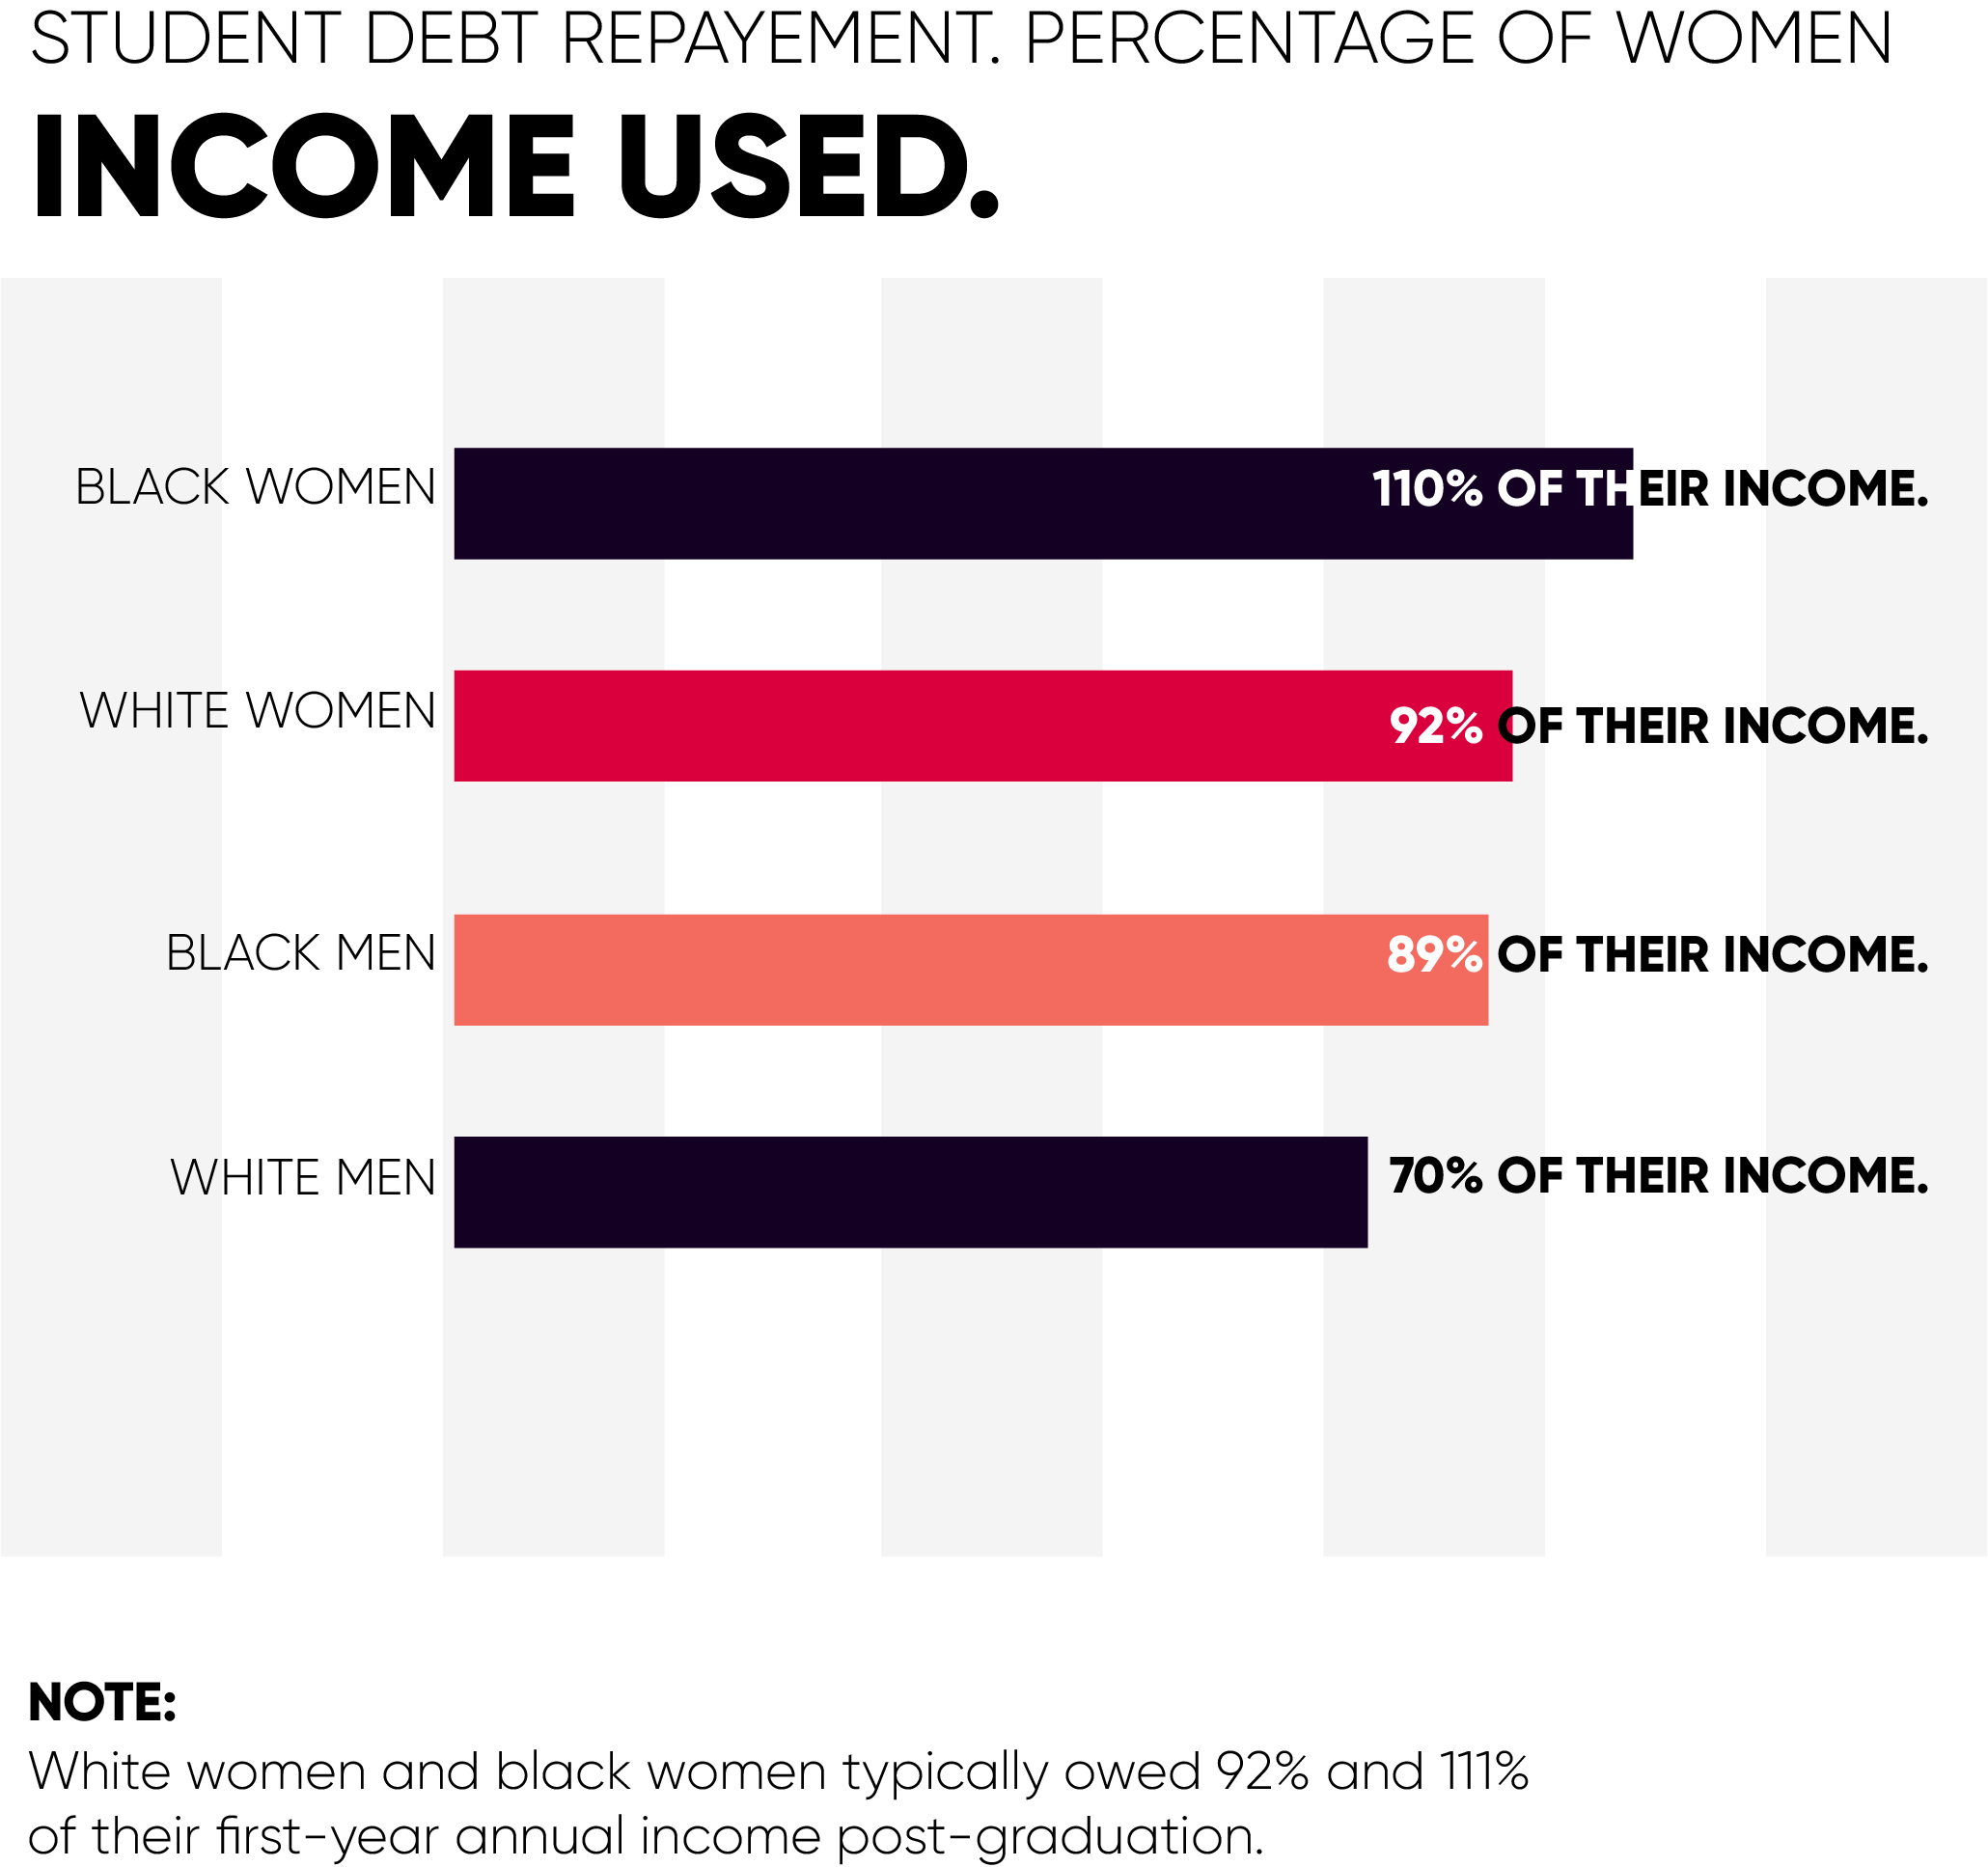
  11. Pallardy, Richard. “Racial Disparities in Student Loan Debt.” Saving for College, 27 Aug. 2019, www.savingforcollege.com/article/racial-disparities-in-student-loan-debt. []
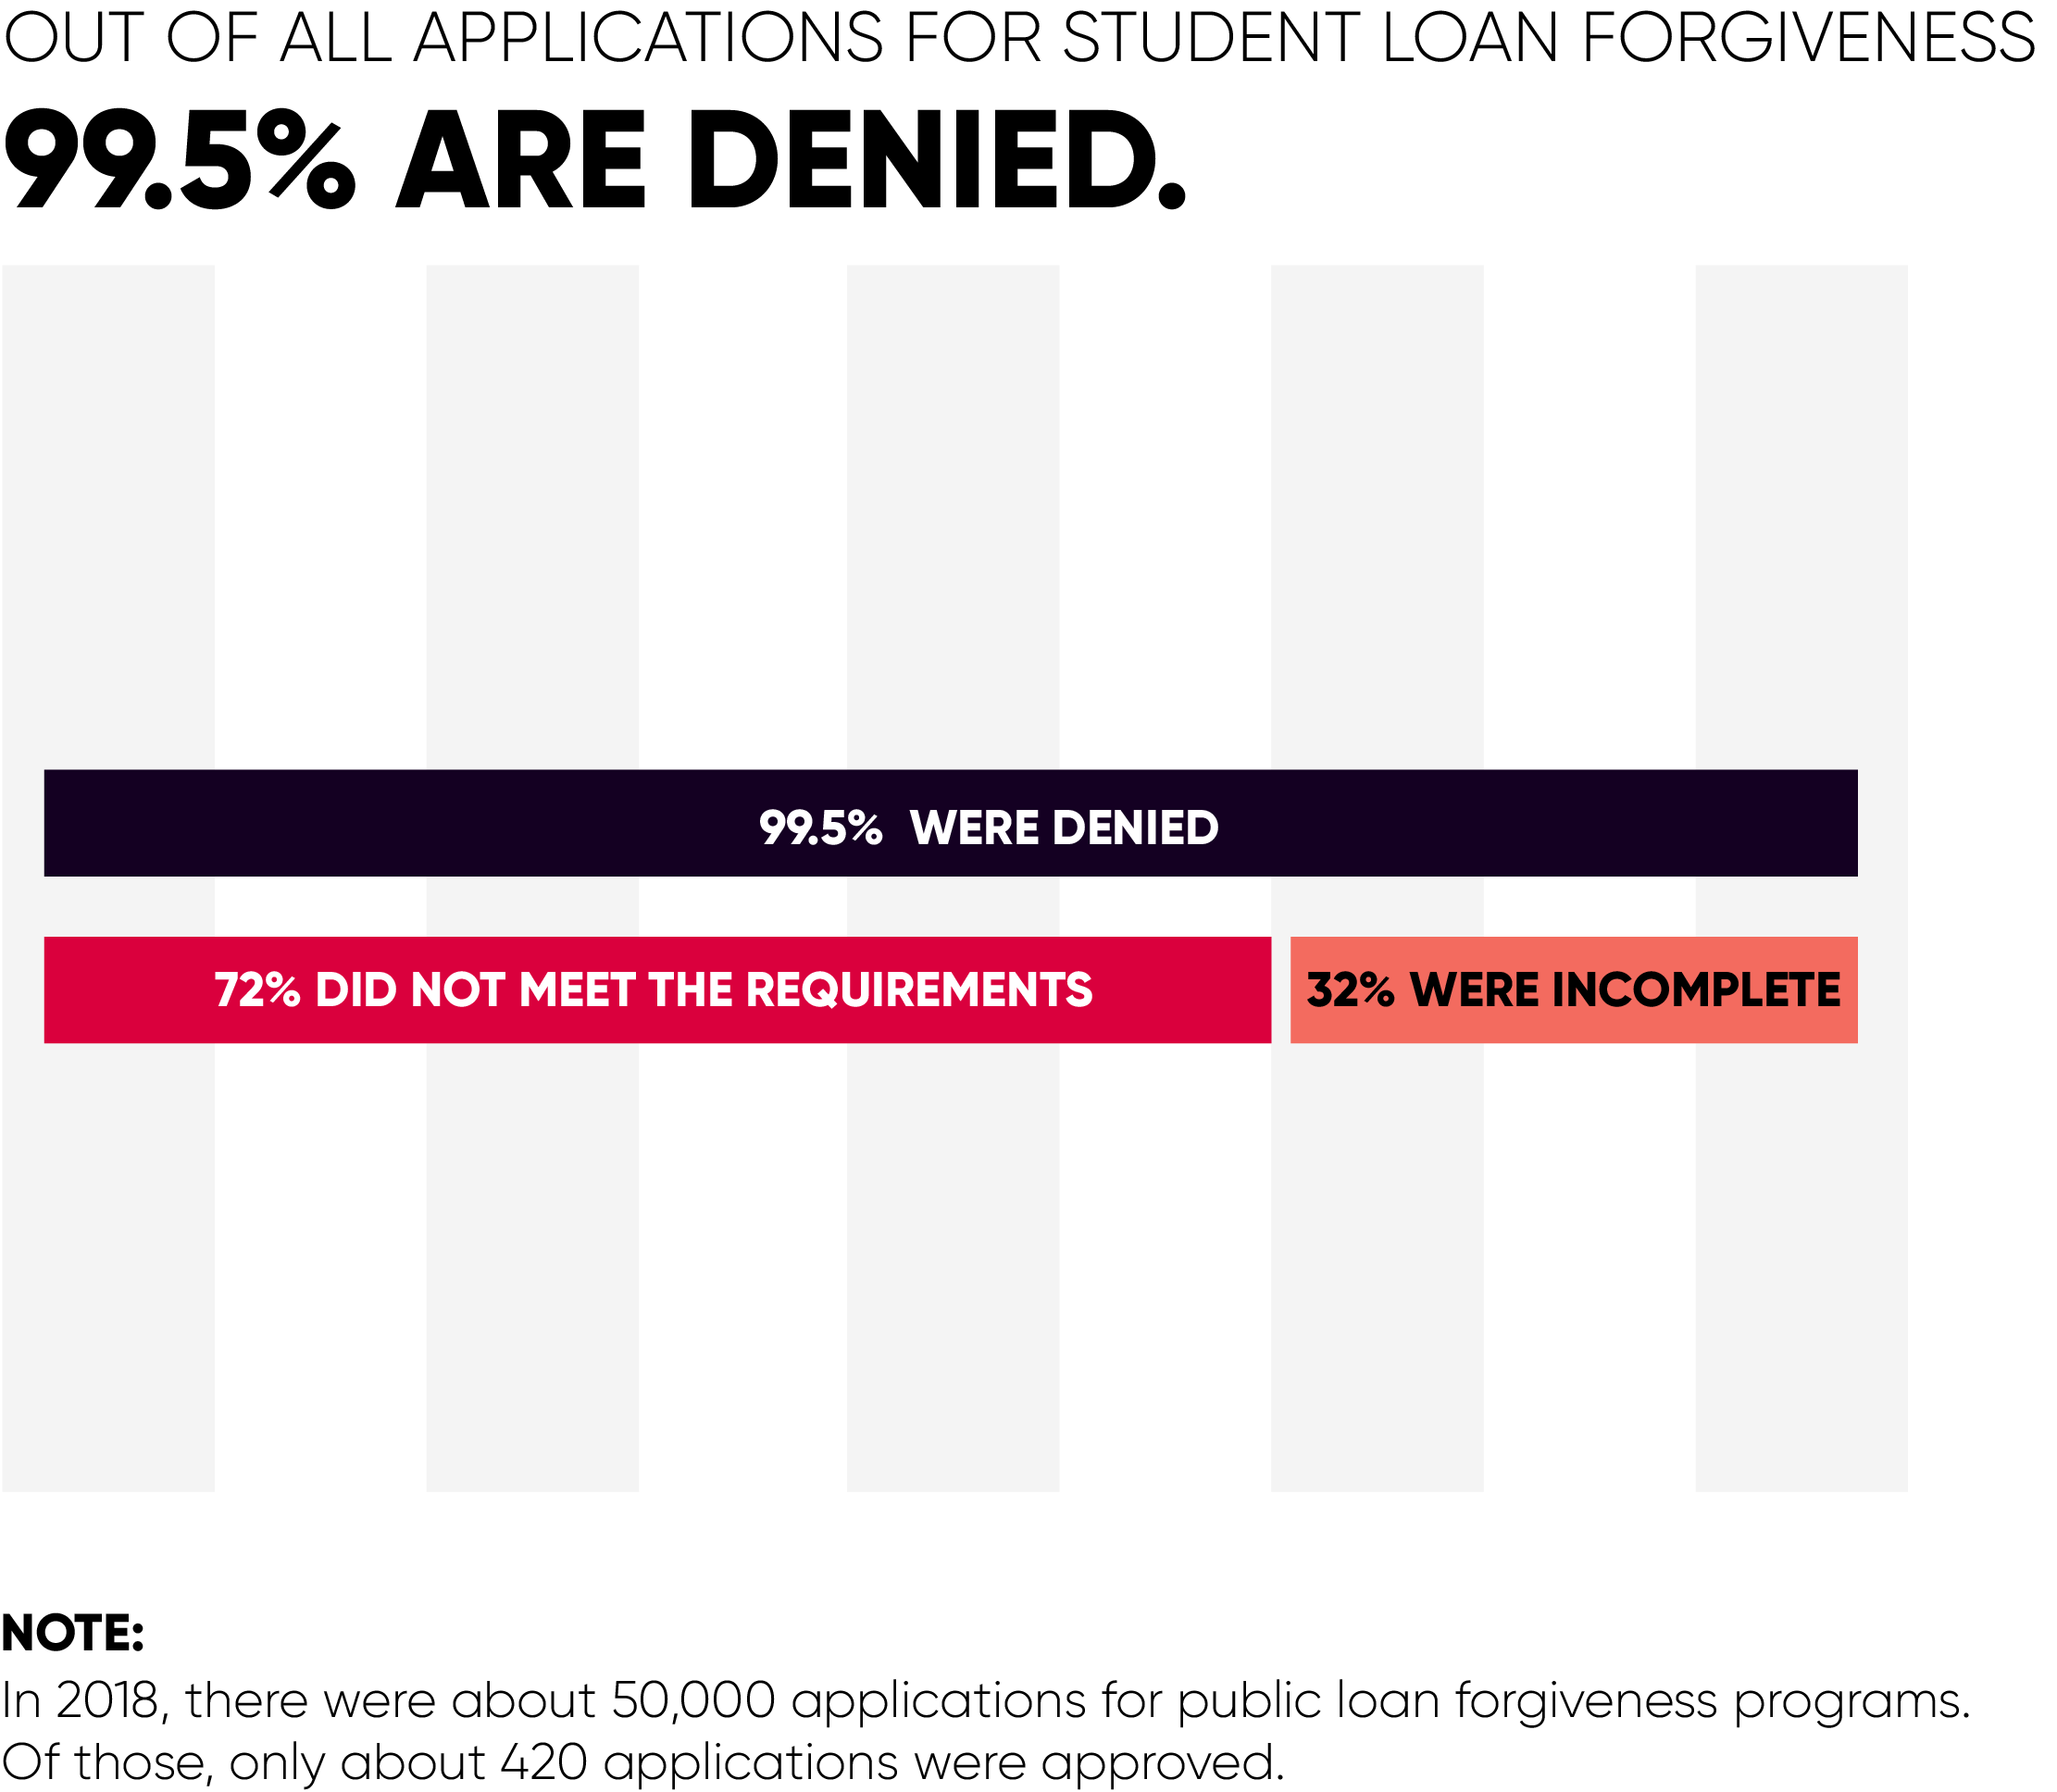
  12. Friedman, Zack. “99.5% Of People Are Rejected For Student Loan Forgiveness Program.” Forbes, Forbes Magazine, 3 Jan. 2019, www.forbes.com/sites/zackfriedman/2019/01/03/student-loan-forgiveness-data/#27b3545568d0. []
  13. Issa, Natalie. “U.S. Average Student Loan Debt Statistics in 2019.” Credit.com, 19 June 2019, www.credit.com/personal-finance/average-student-loan-debt/. []
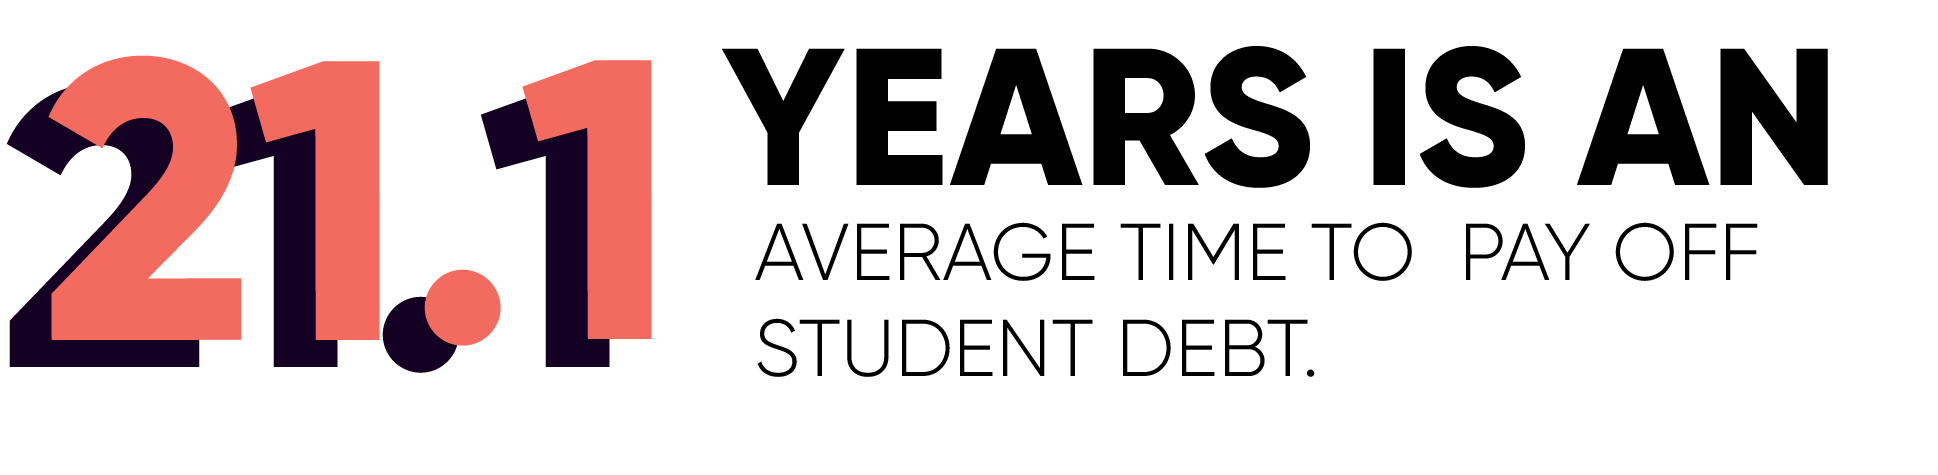
  14. Carter, Matt. “Average Time to Repay Student Loans in the U.S.” Credible, 18 Dec. 2019, www.credible.com/blog/statistics/average-time-to-repay-student-loans-statistics/. [] []
  15. “U.S. Student Loan Debt Statistics for 2019.” Student Loan Hero, 4 Feb. 2019, studentloanhero.com/student-loan-debt-statistics/. [] []
  16. Brown, Mike. “Tracking the Private Student Loan Industry.” LendEDU, 16 July 2019, lendedu.com/blog/state-of-private-student-loans-report/. []
  17. “Are Student Loans Making Borrowers Delay Life Decisions?” SoFi, 16 May 2019, www.sofi.com/learn/content/student-loans-and-life-decisions/. []
  18. Lloyd, Alcynna. “America’s Debt-Burdened Millennials Are Delaying Homeownership by 7 Years.” HousingWire, 9 Aug. 2019, www.housingwire.com/articles/49819-americas-debt-burdened-millennials-are-delaying-homeownership-by-7-years/. []